The Discover series · 2027 edition · Out now
Discover El Niño.
When the Pacific Turns and the Planet Follows
The science behind the world's biggest climate event, from the Great El Niño of 1877 to the Super El Niño of 2026-27.

The 2026-27 super El Niño, right now
The Pacific is running a fever.
El Niño is strengthening and is expected to keep growing to the end of 2026, with a strong-to-very strong event likely through January-March 2027. NOAA gives an 83% chance that October-December will pass +2.5°C on its relative index, beyond every El Niño since 1950. Outlooks change: check the next update.
Source: NOAA Climate Prediction Center, ENSO Diagnostic Discussion of 8 October 2026. Next update 12 November 2026. Read NOAA's latest.
What the book explains
One warm current.
Every continent.
Every few years a patch of the tropical Pacific warms, the trade winds falter, and weather changes on every continent: floods in the Peruvian desert, drought in Australia and Indonesia, storms in California, record heat worldwide. Discover El Niño explains how it happens, from the planet's normal winds and currents to the moment the Pacific tips over.
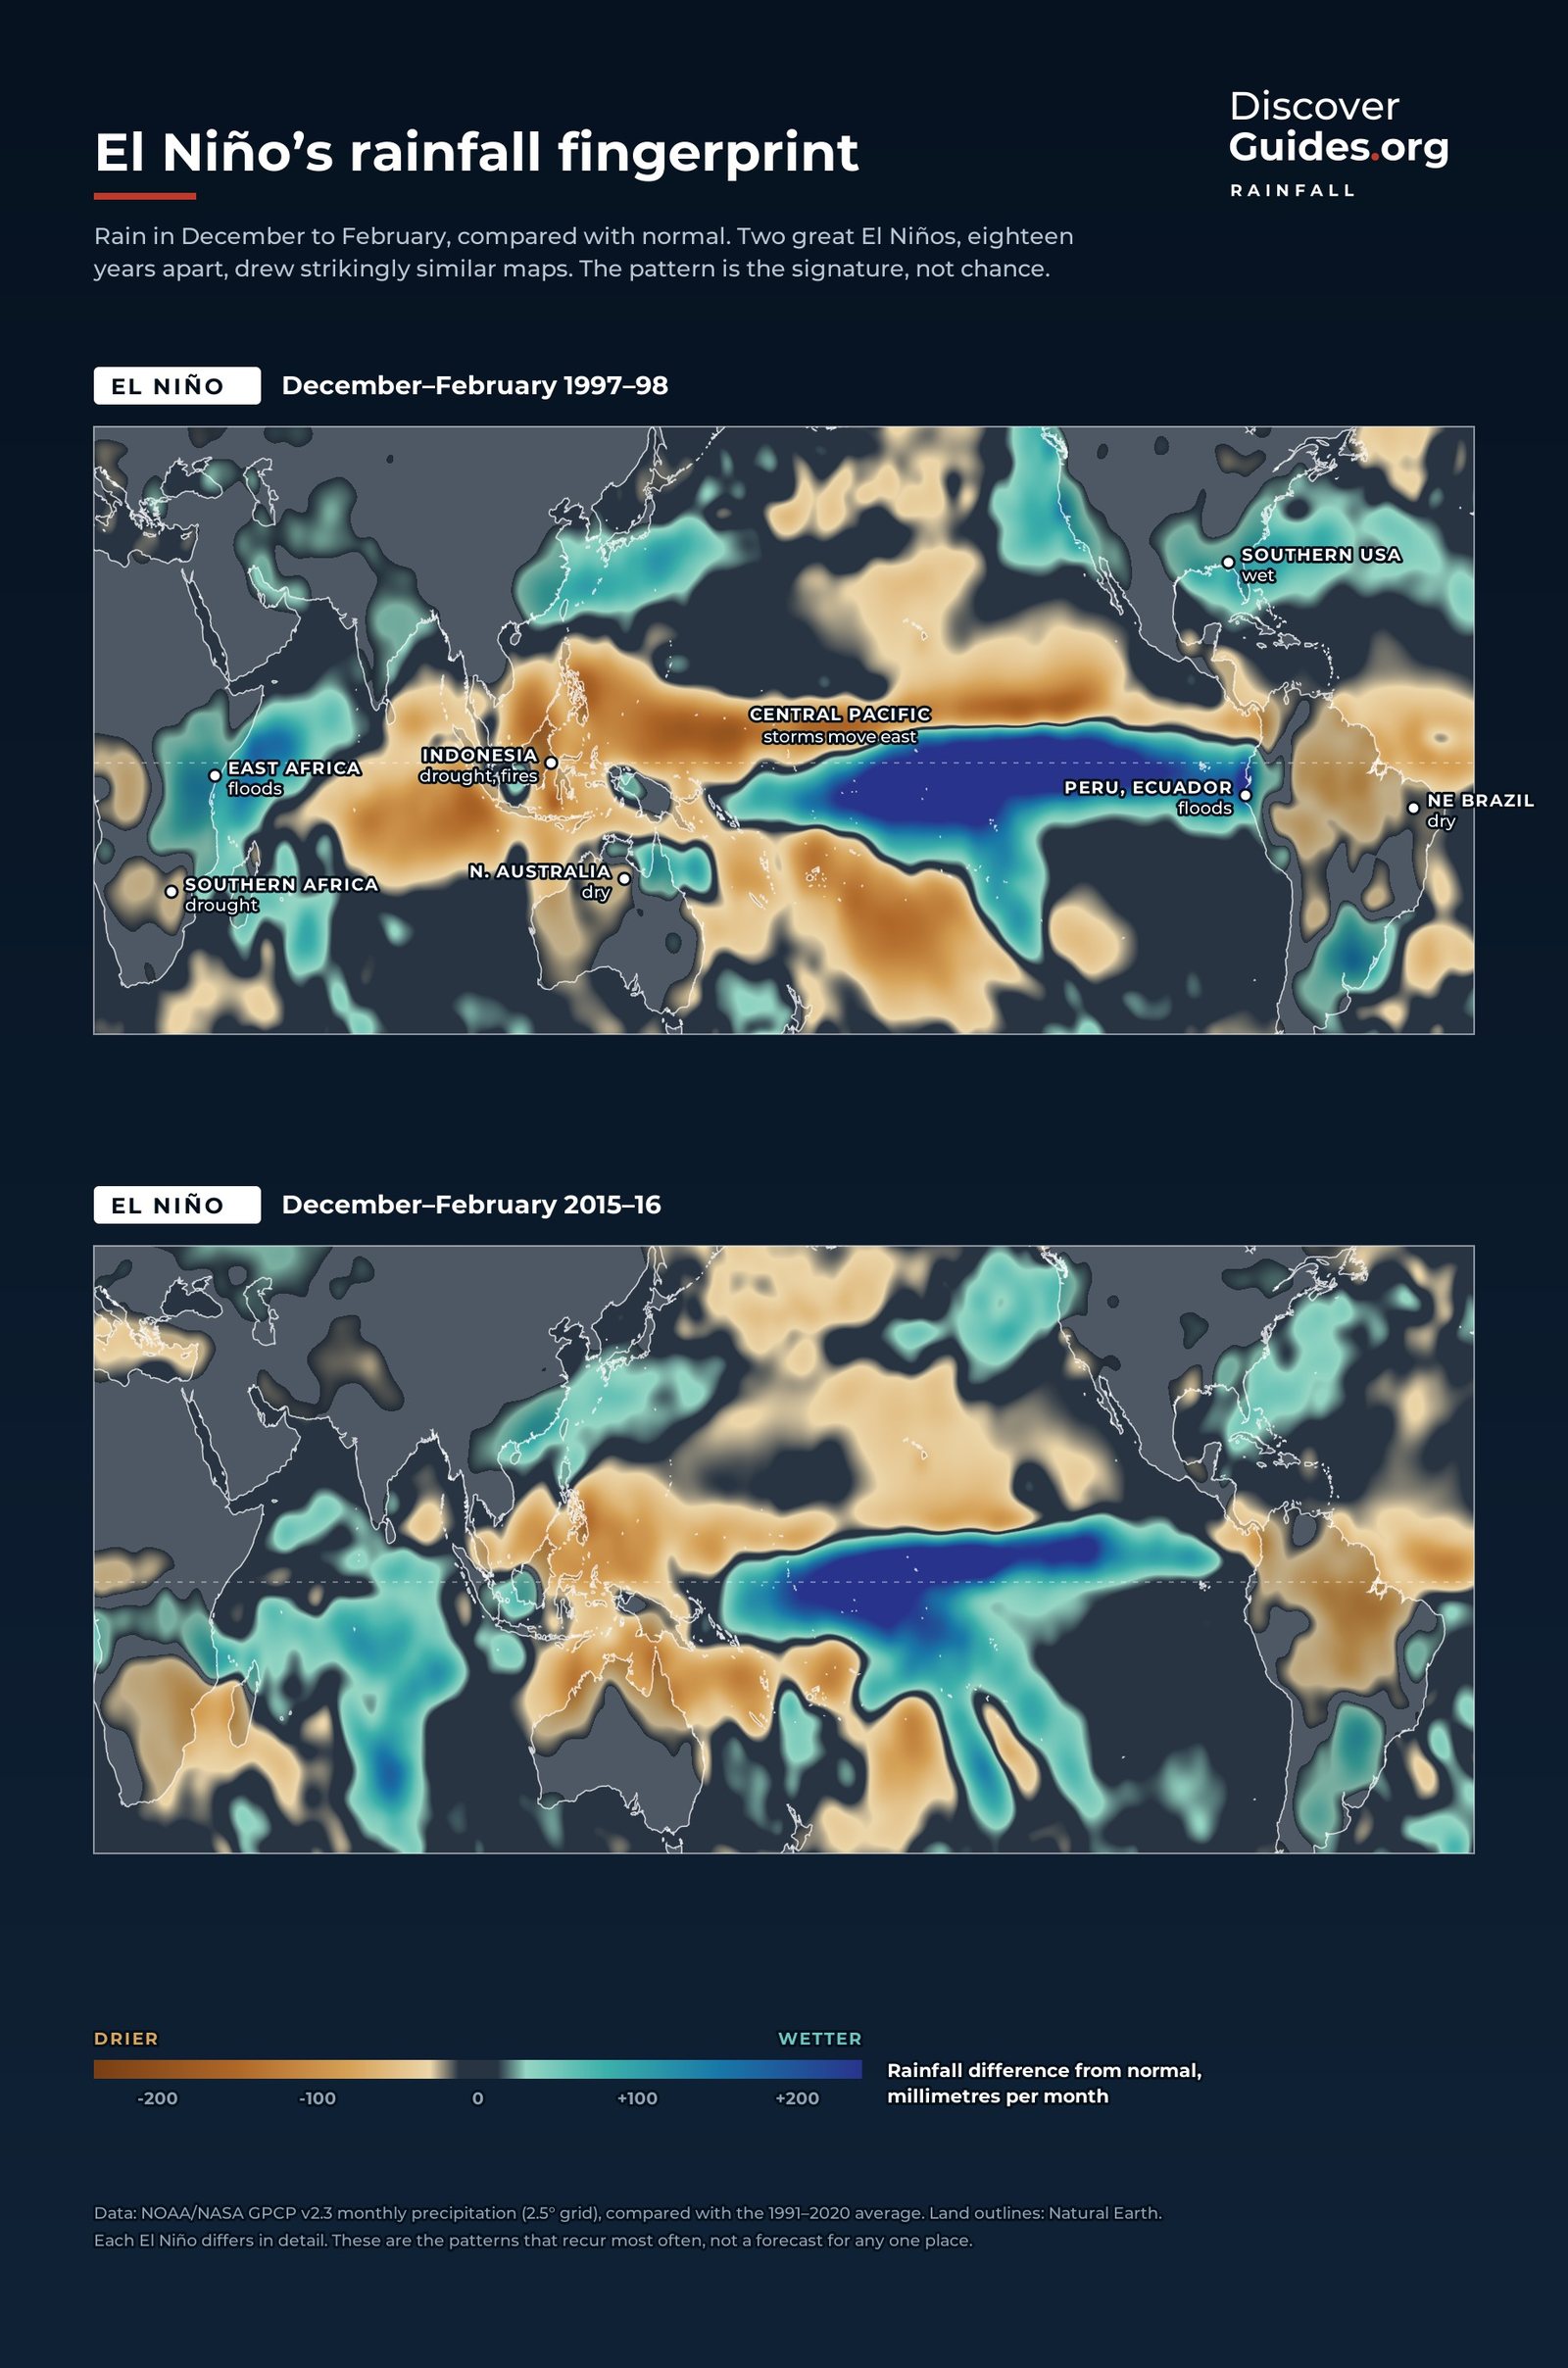
It tells the story of the great events, 1877-78, 1982-83, 1997-98, 2015-16 and 2023-24, follows the 2026-27 super El Niño as it unfolds, and shows how forecasters see it coming. More than 30 original maps and graphics, redrawn from NOAA, NASA and Copernicus data, make it visible.
- Inside
- 24 chapters in 5 parts
- Graphics
- 30+ original maps and diagrams
- Data
- NOAA, NASA, Copernicus
- Edition
- 2027
Inside the book
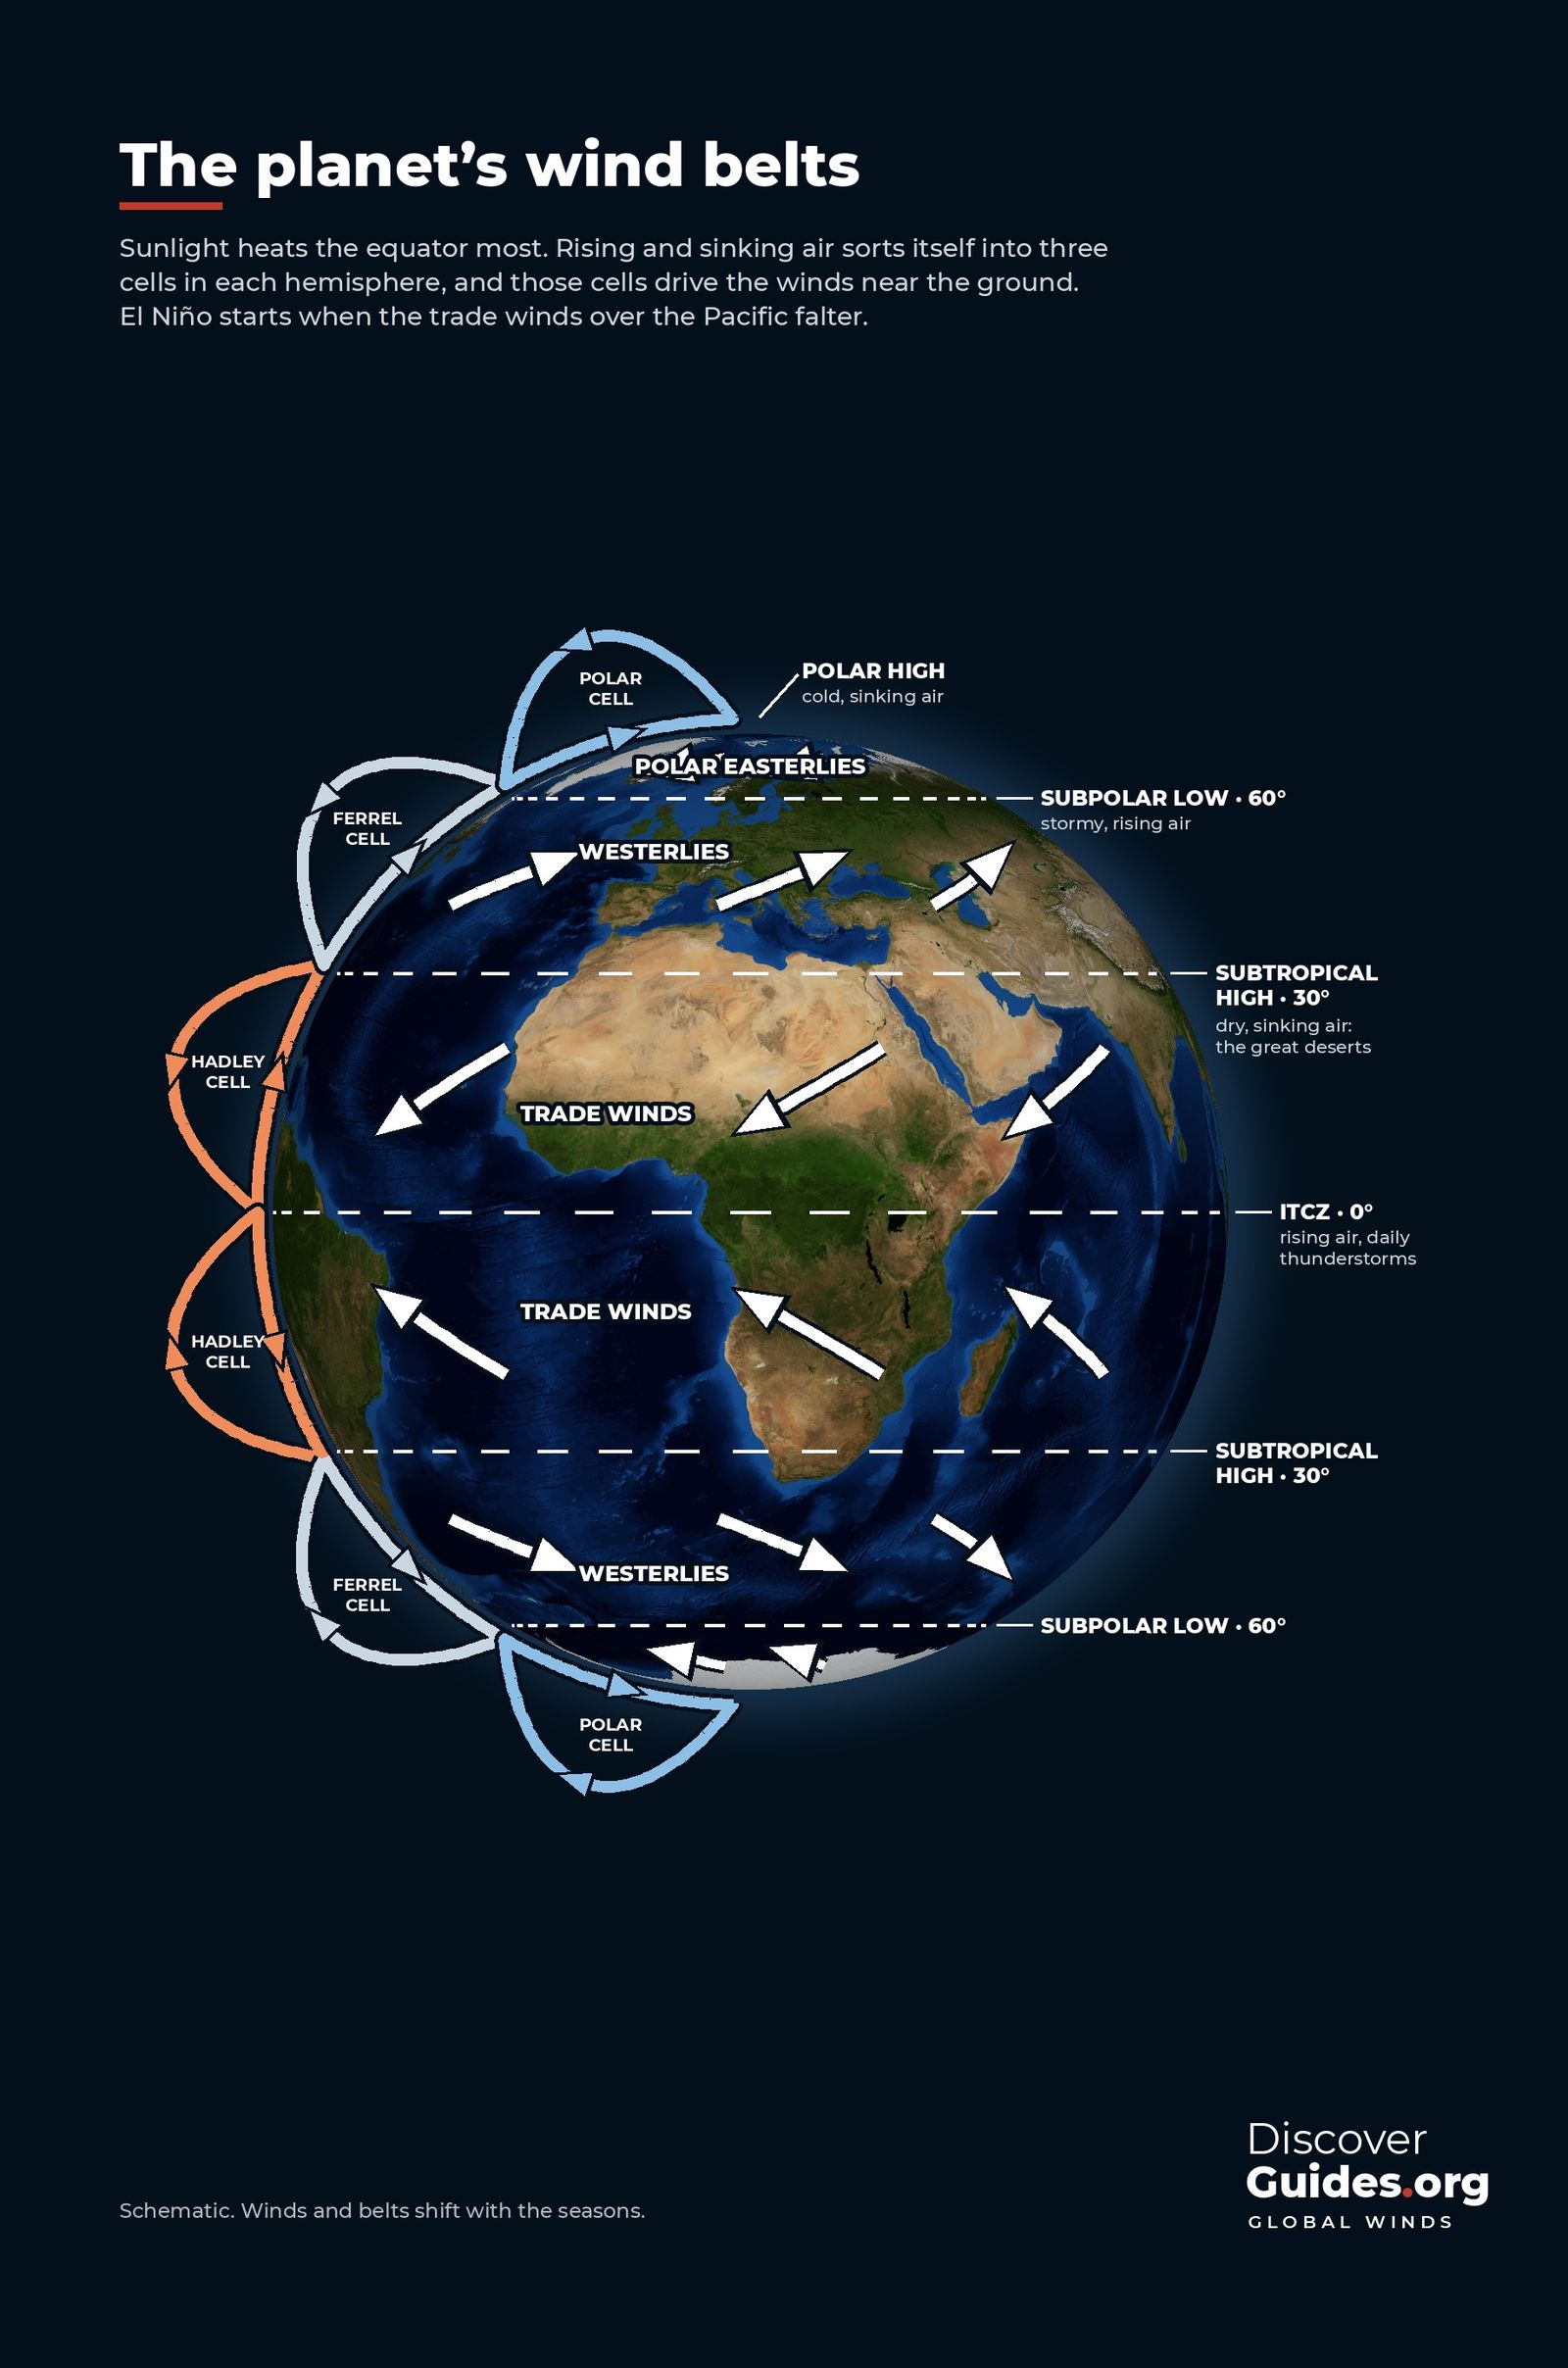
Made to be seen.
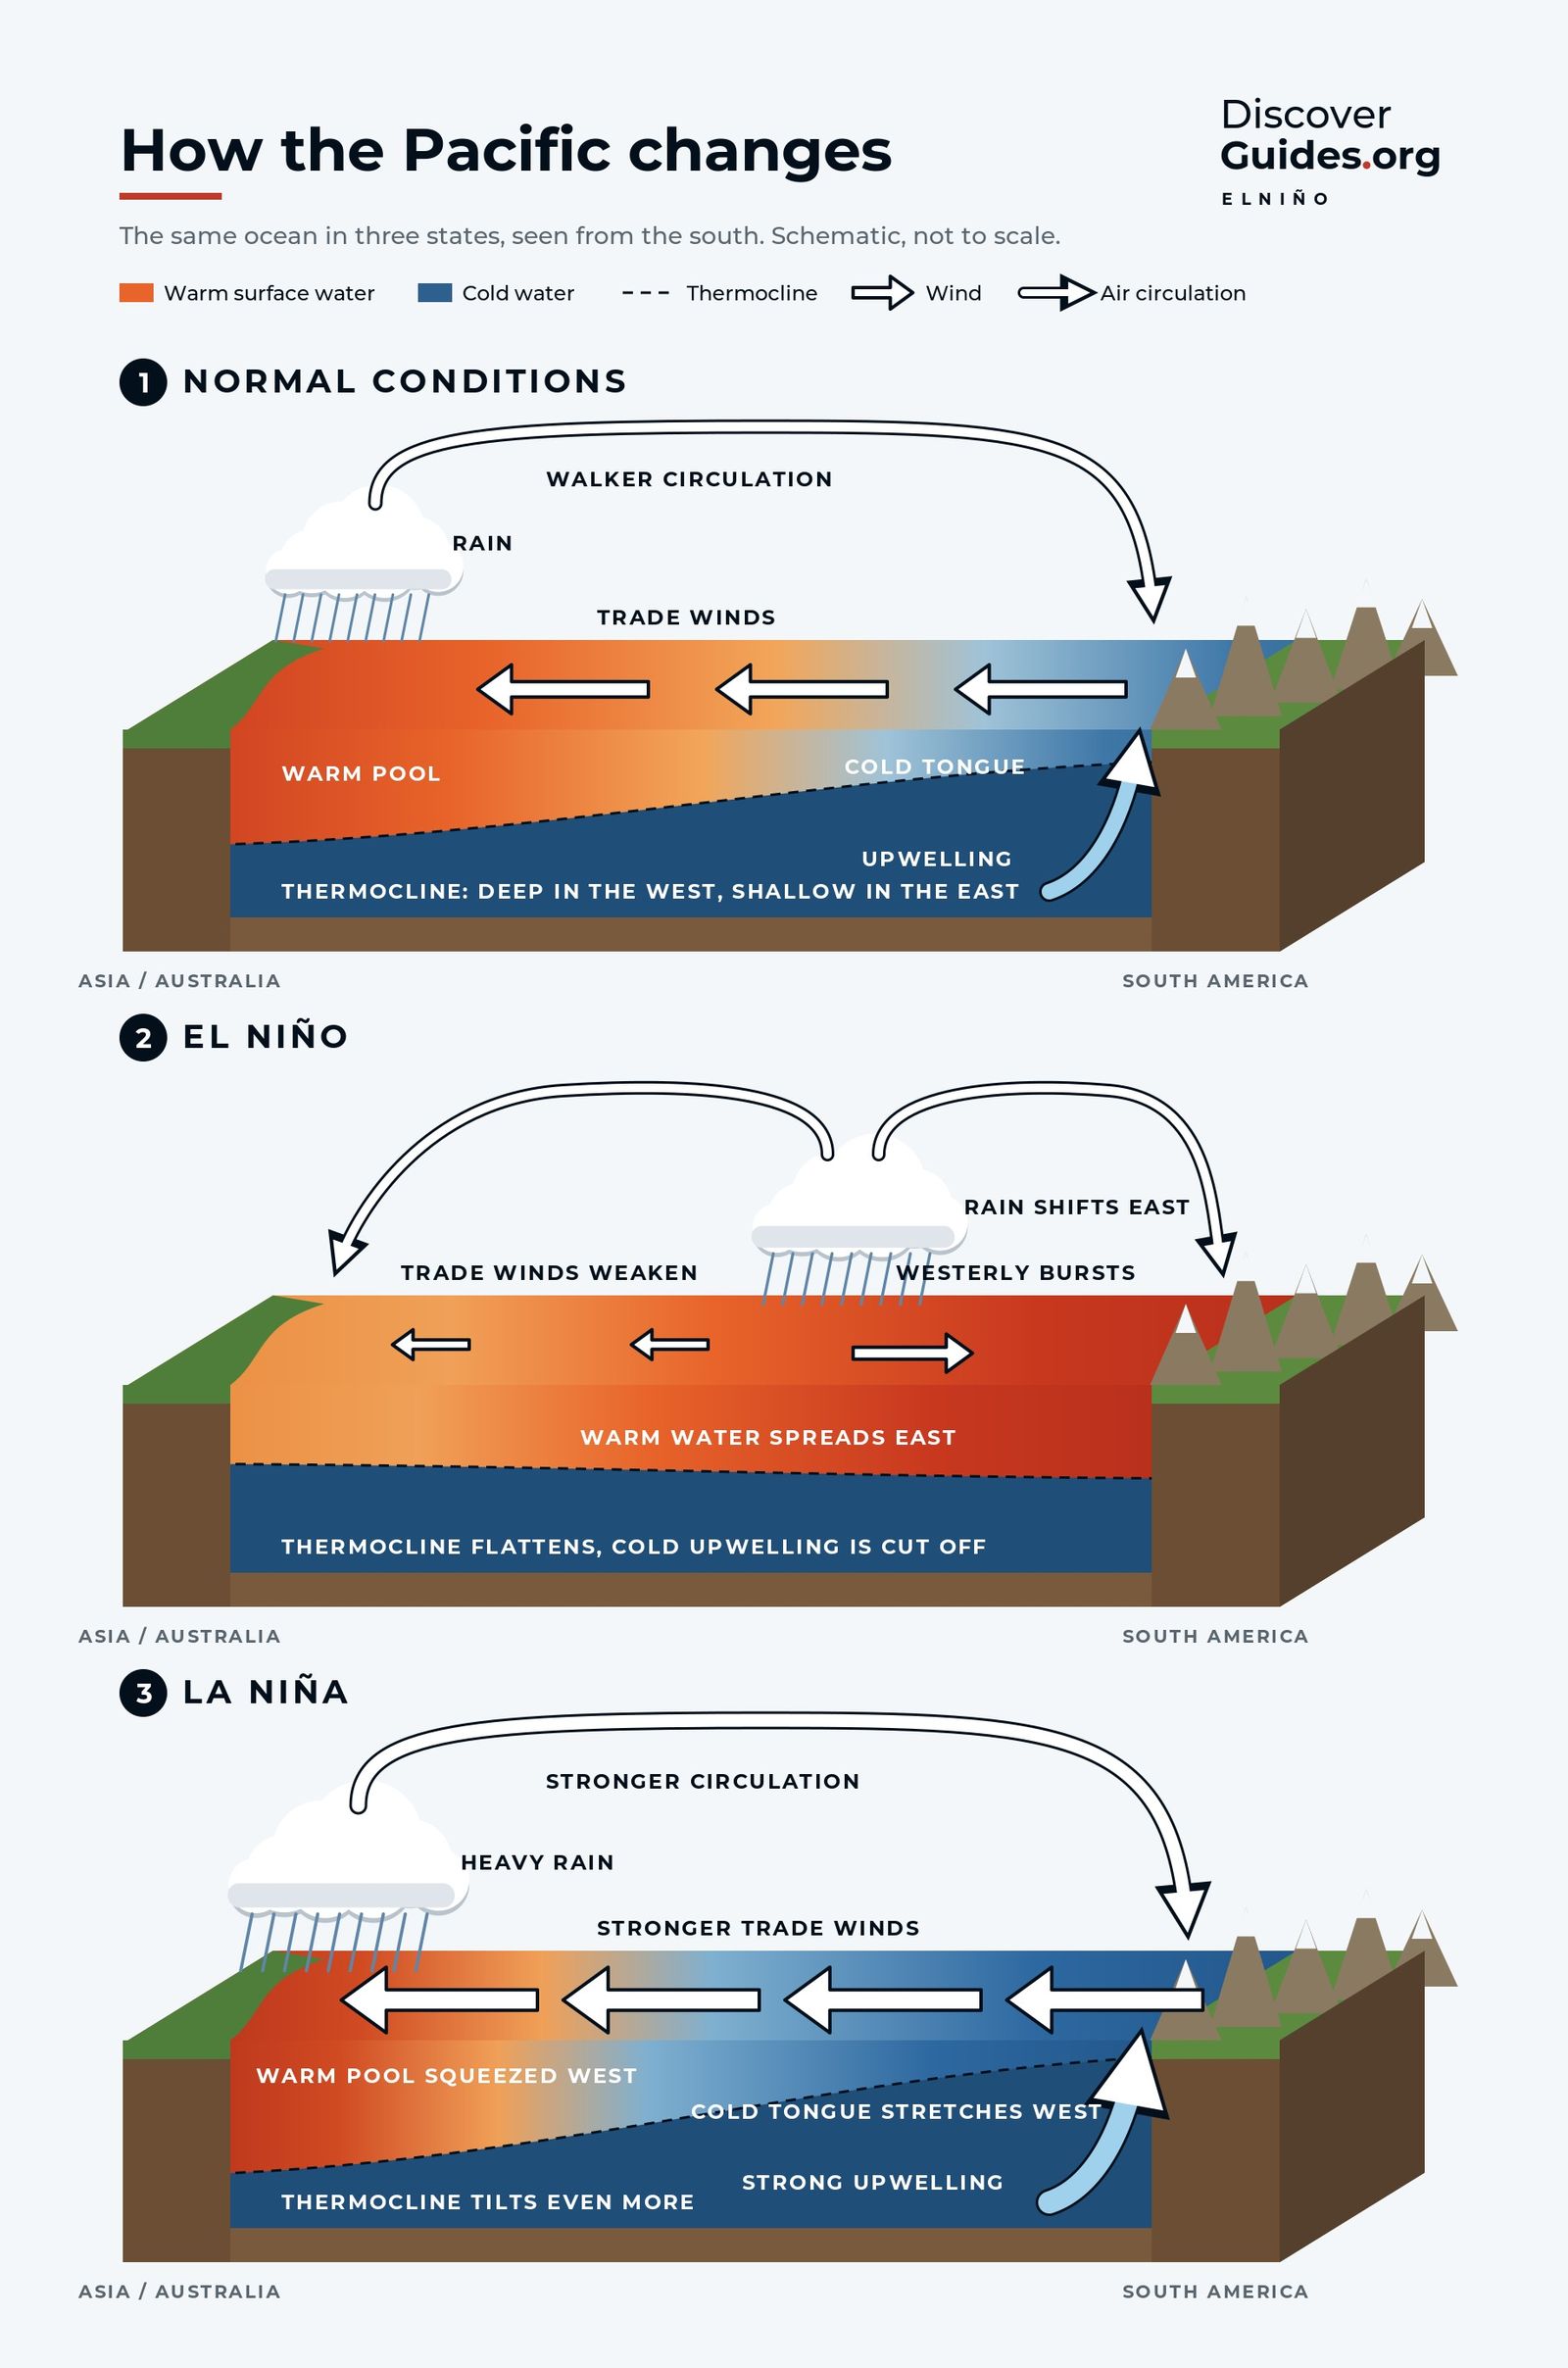
More than 30 maps and diagrams, each one drawn for this book from NOAA, NASA and Copernicus data. Four of them:
Contents
Five parts, 24 chapters.
Part I
How the planet normally works
- The Engine: sun, heat and the global wind belts
- Rivers of Air: the jet streams
- The Moving Ocean: currents, thermocline, upwelling
- The Pacific Machine: warm pool, Walker circulation, Southern Oscillation
Part II
El Niño and La Niña
- What happens in an El Niño
- La Niña, the cold sister
- Anatomy of an event: birth, peak, decay
- How El Niño bends the winds
- Flavours and measures: Niño regions, ONI, super events
Part III
The weather it makes
- Tropical cyclones
- Atmospheric rivers, storms and floods
- Drought, fire and haze
- Heat and global temperature records
- Monsoons of Asia, Africa and Australia
Part IV
El Niños of the past
- Discovering El Niño: from Peruvian fishermen to Bjerknes
- 1877-78: the Great El Niño
- 1982-83 and 1997-98: the century's giants
- 2015-16 and 2023-24: the record-heat years
- La Niña's long reign
Part V
2026-27 and the future
- The 2026-27 super El Niño
- Life in hot water: coral, fish, seabirds, Galápagos
- People and El Niño: food, water, health
- Forecasting: buoys, satellites, models
- El Niño in a warming world
El Niños of the past
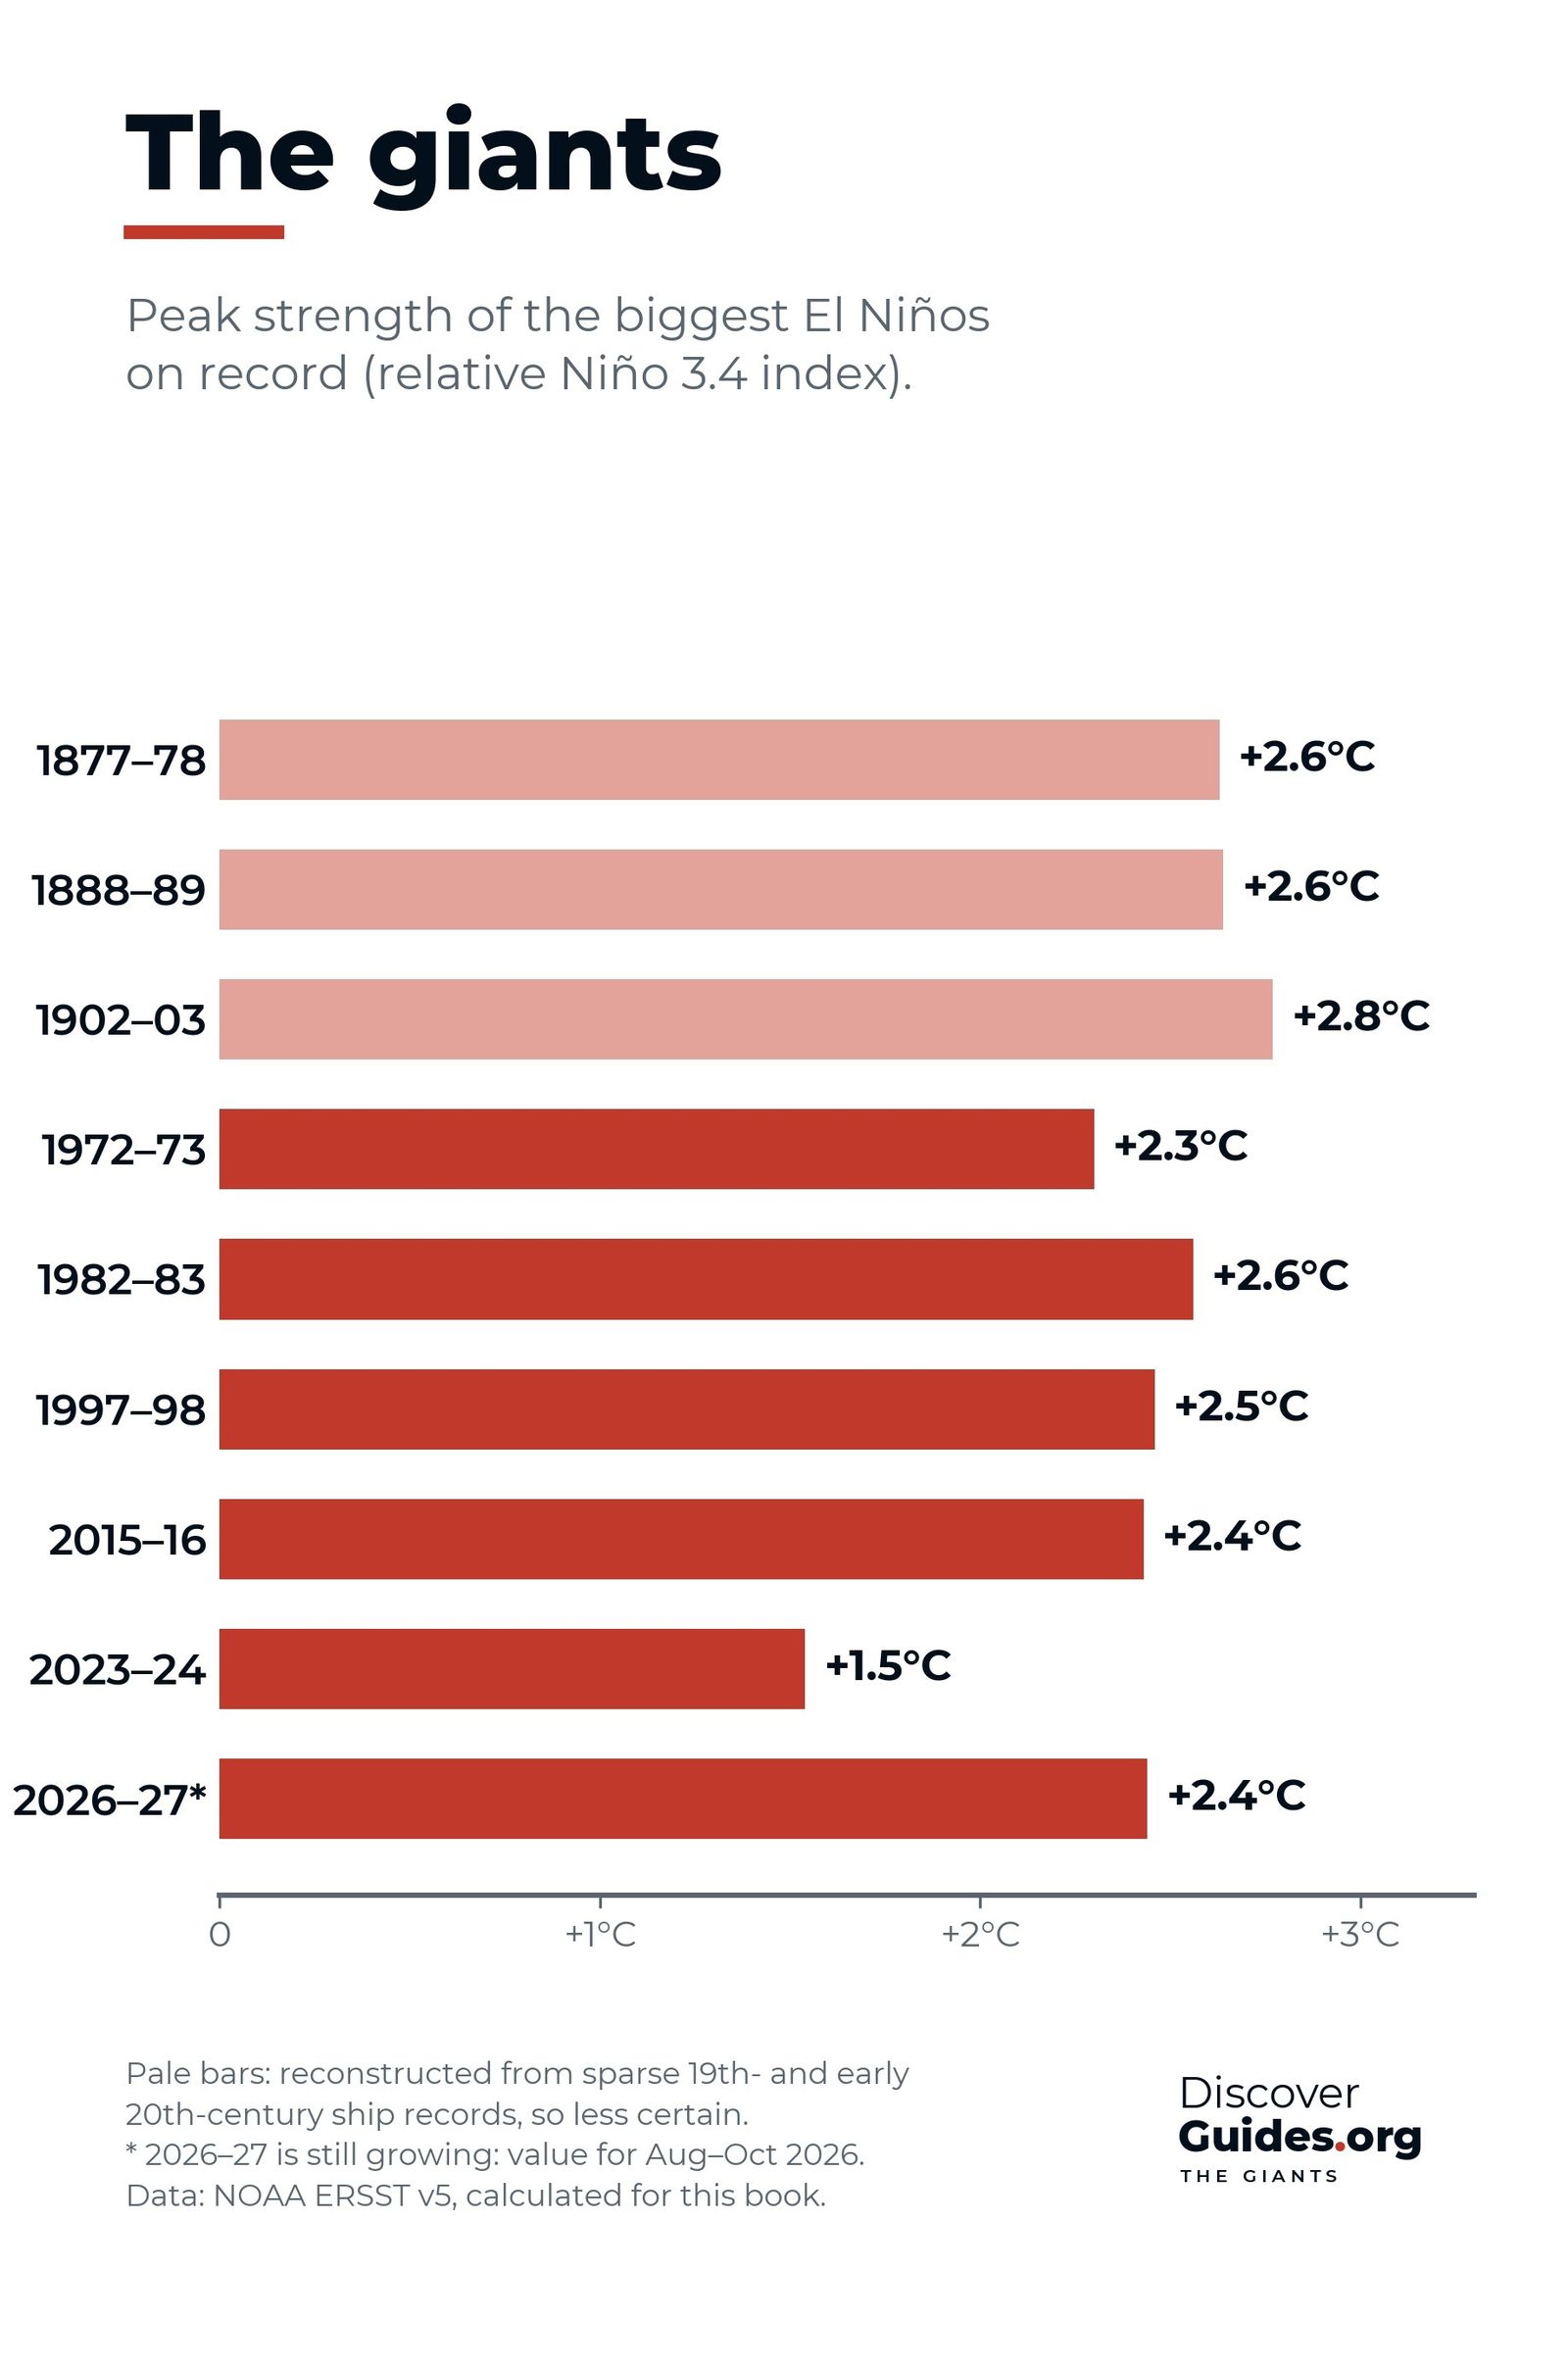
The giants.
1877-78 starved millions. 1982-83 caught the world by surprise. 1997-98 was the event of the century, until 2015-16 and 2023-24 set new heat records. The book tells each one, and measures 2026-27 against them.
The strongest El Niños, rankedFree to read · 50 articles
The El Niño articles.
Straight answers, drawn with the book's own graphics: what El Niño is, how it starts, what it does to the weather, the giants of the past and the event happening now.
 El Niño basics
What is El Niño?
El Niño explained: how a warm patch of the tropical Pacific shifts rain, storms and heat around the world, how it is measured, and why it keeps coming back.
 El Niño basics
El Niño vs La Niña
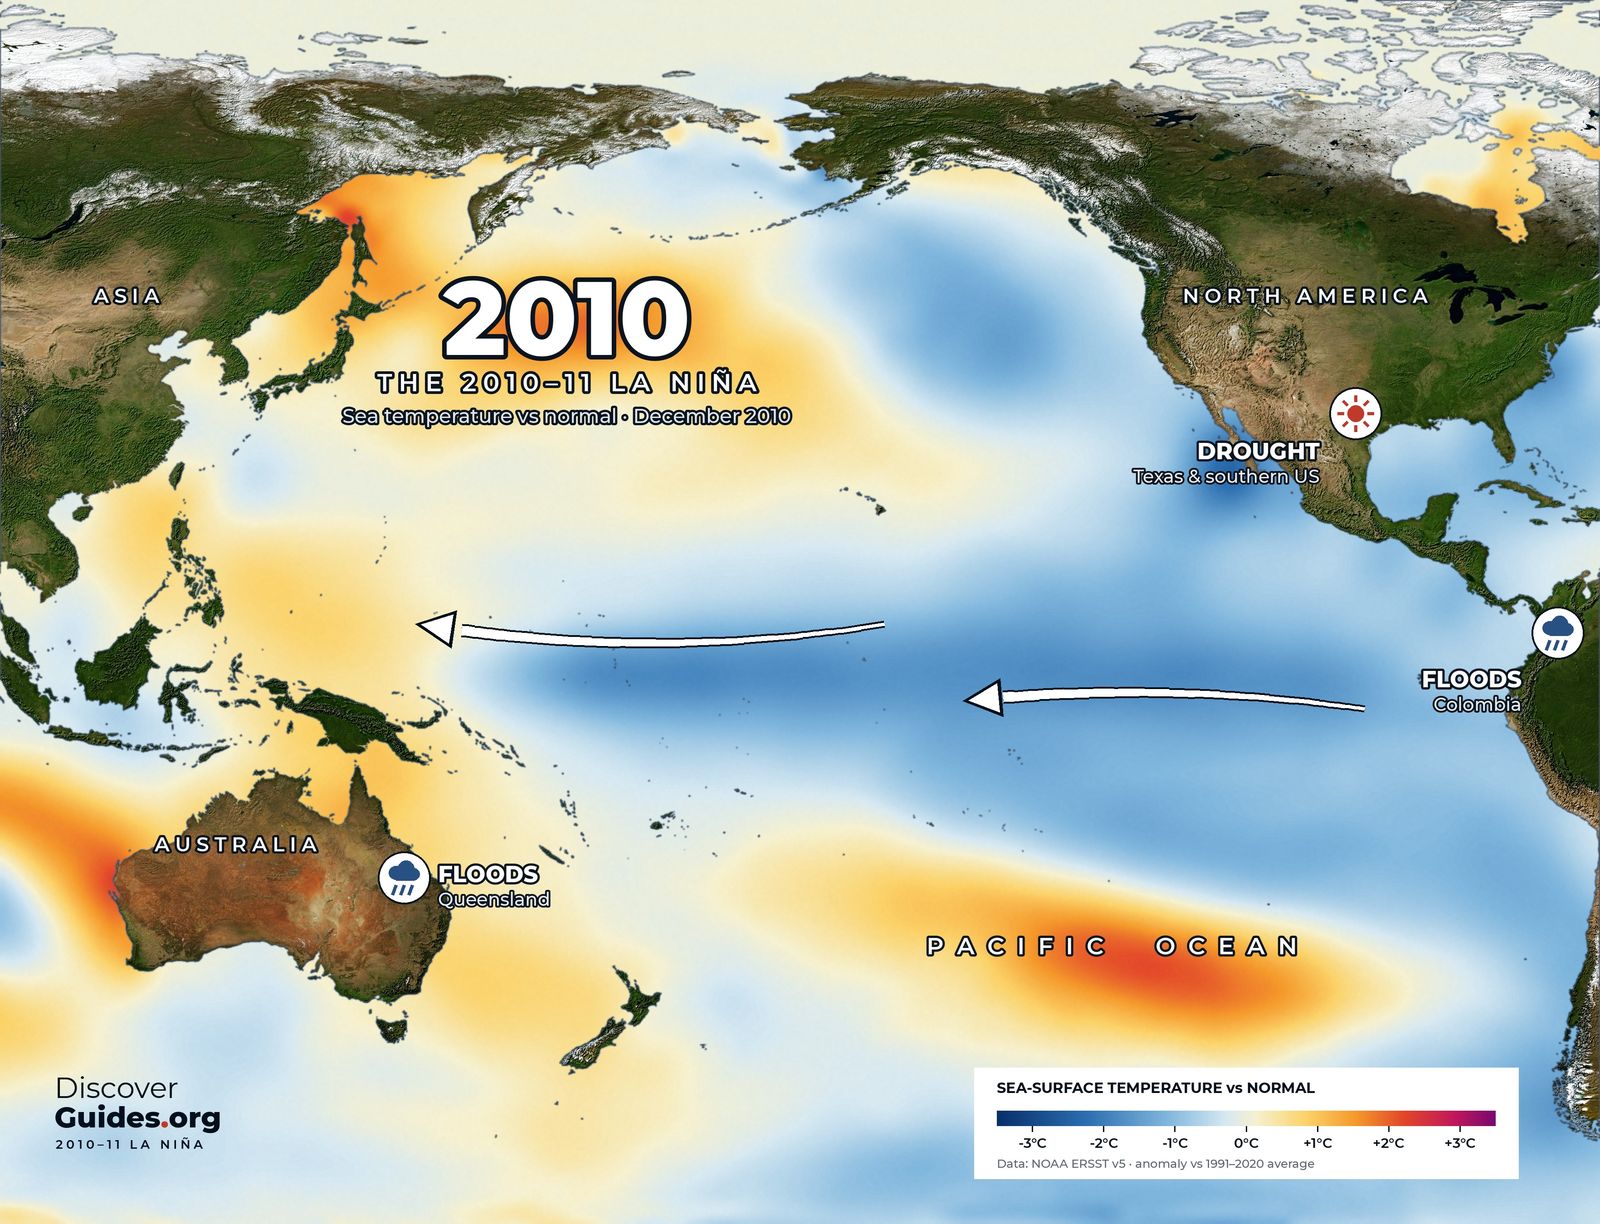
El Niño vs La Niña side by side: winds, ocean temperatures, rain, storms and global heat, with the record-breaking 2010-11 La Niña as a real-world example.
 2026-27 event
The 2026-27 super El Niño
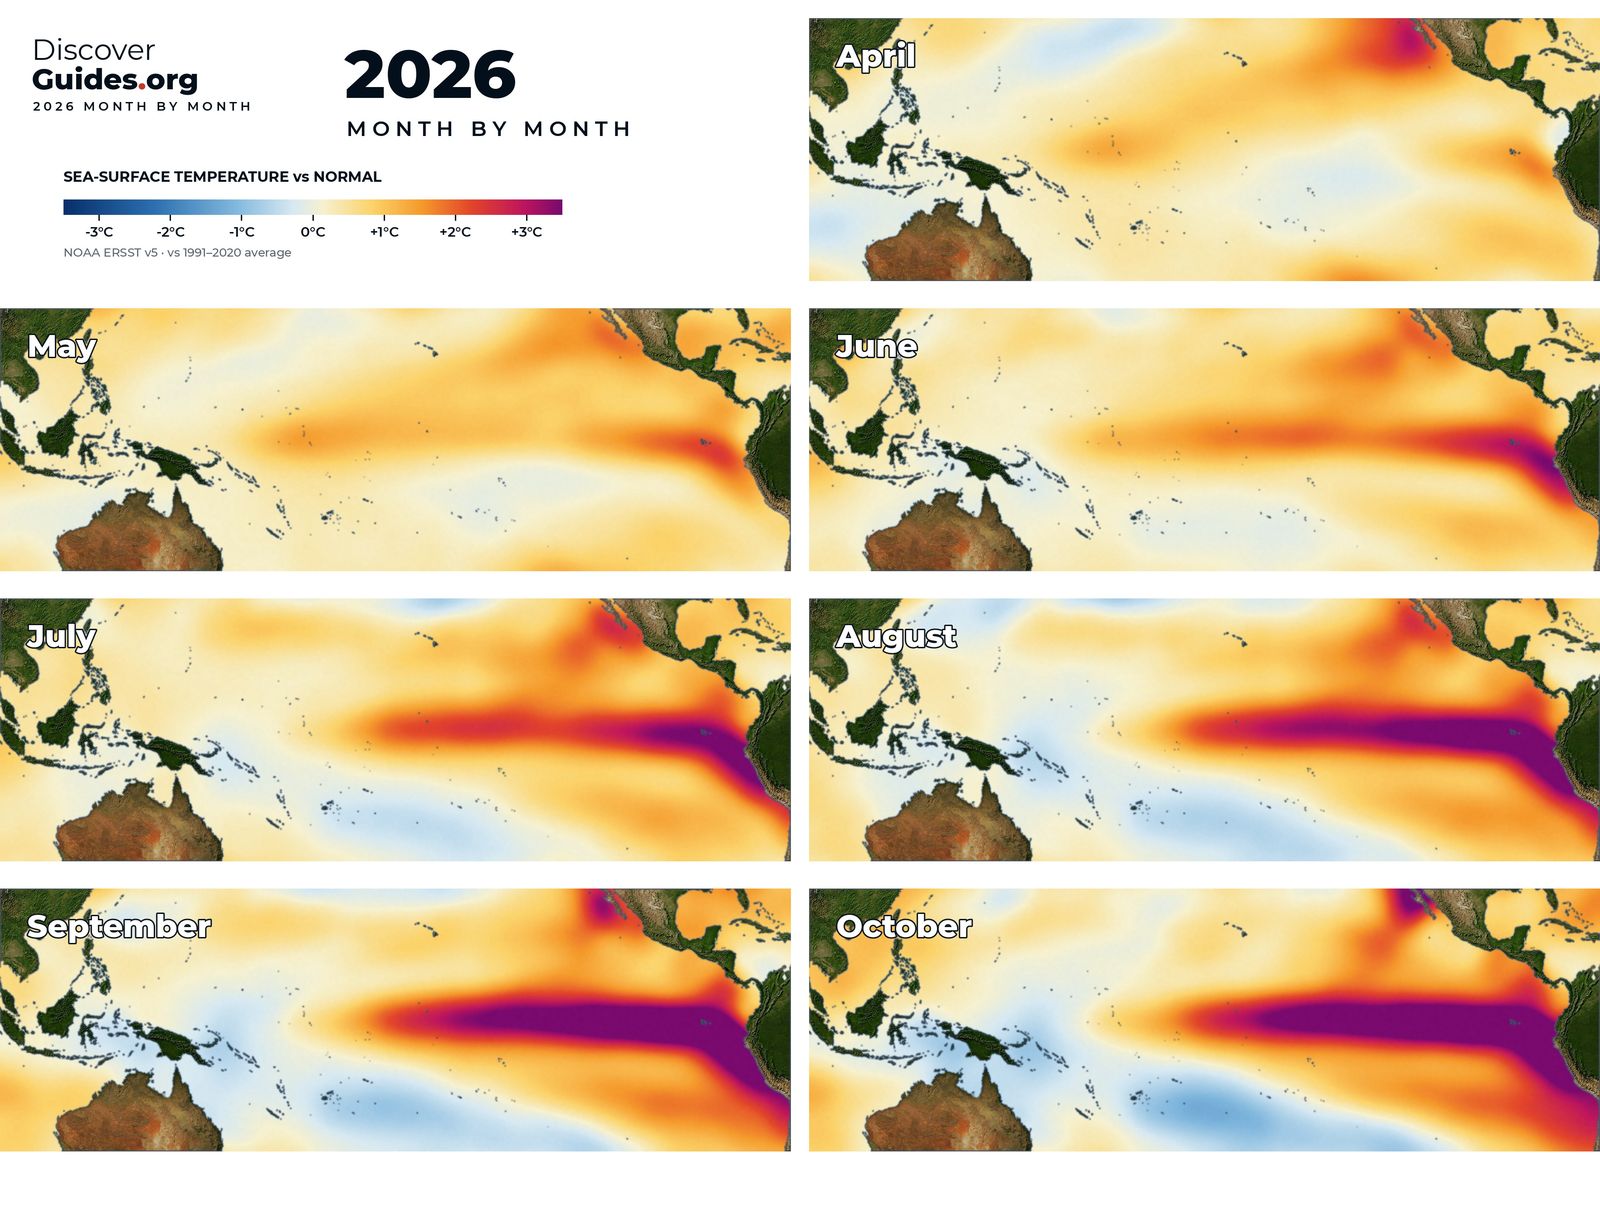
The 2026-27 El Niño as of NOAA's October 2026 update: how strong it is, how it compares with 1982-83, 1997-98 and 2015-16, and what to expect in 2027.
 El Niño basics
How an El Niño starts
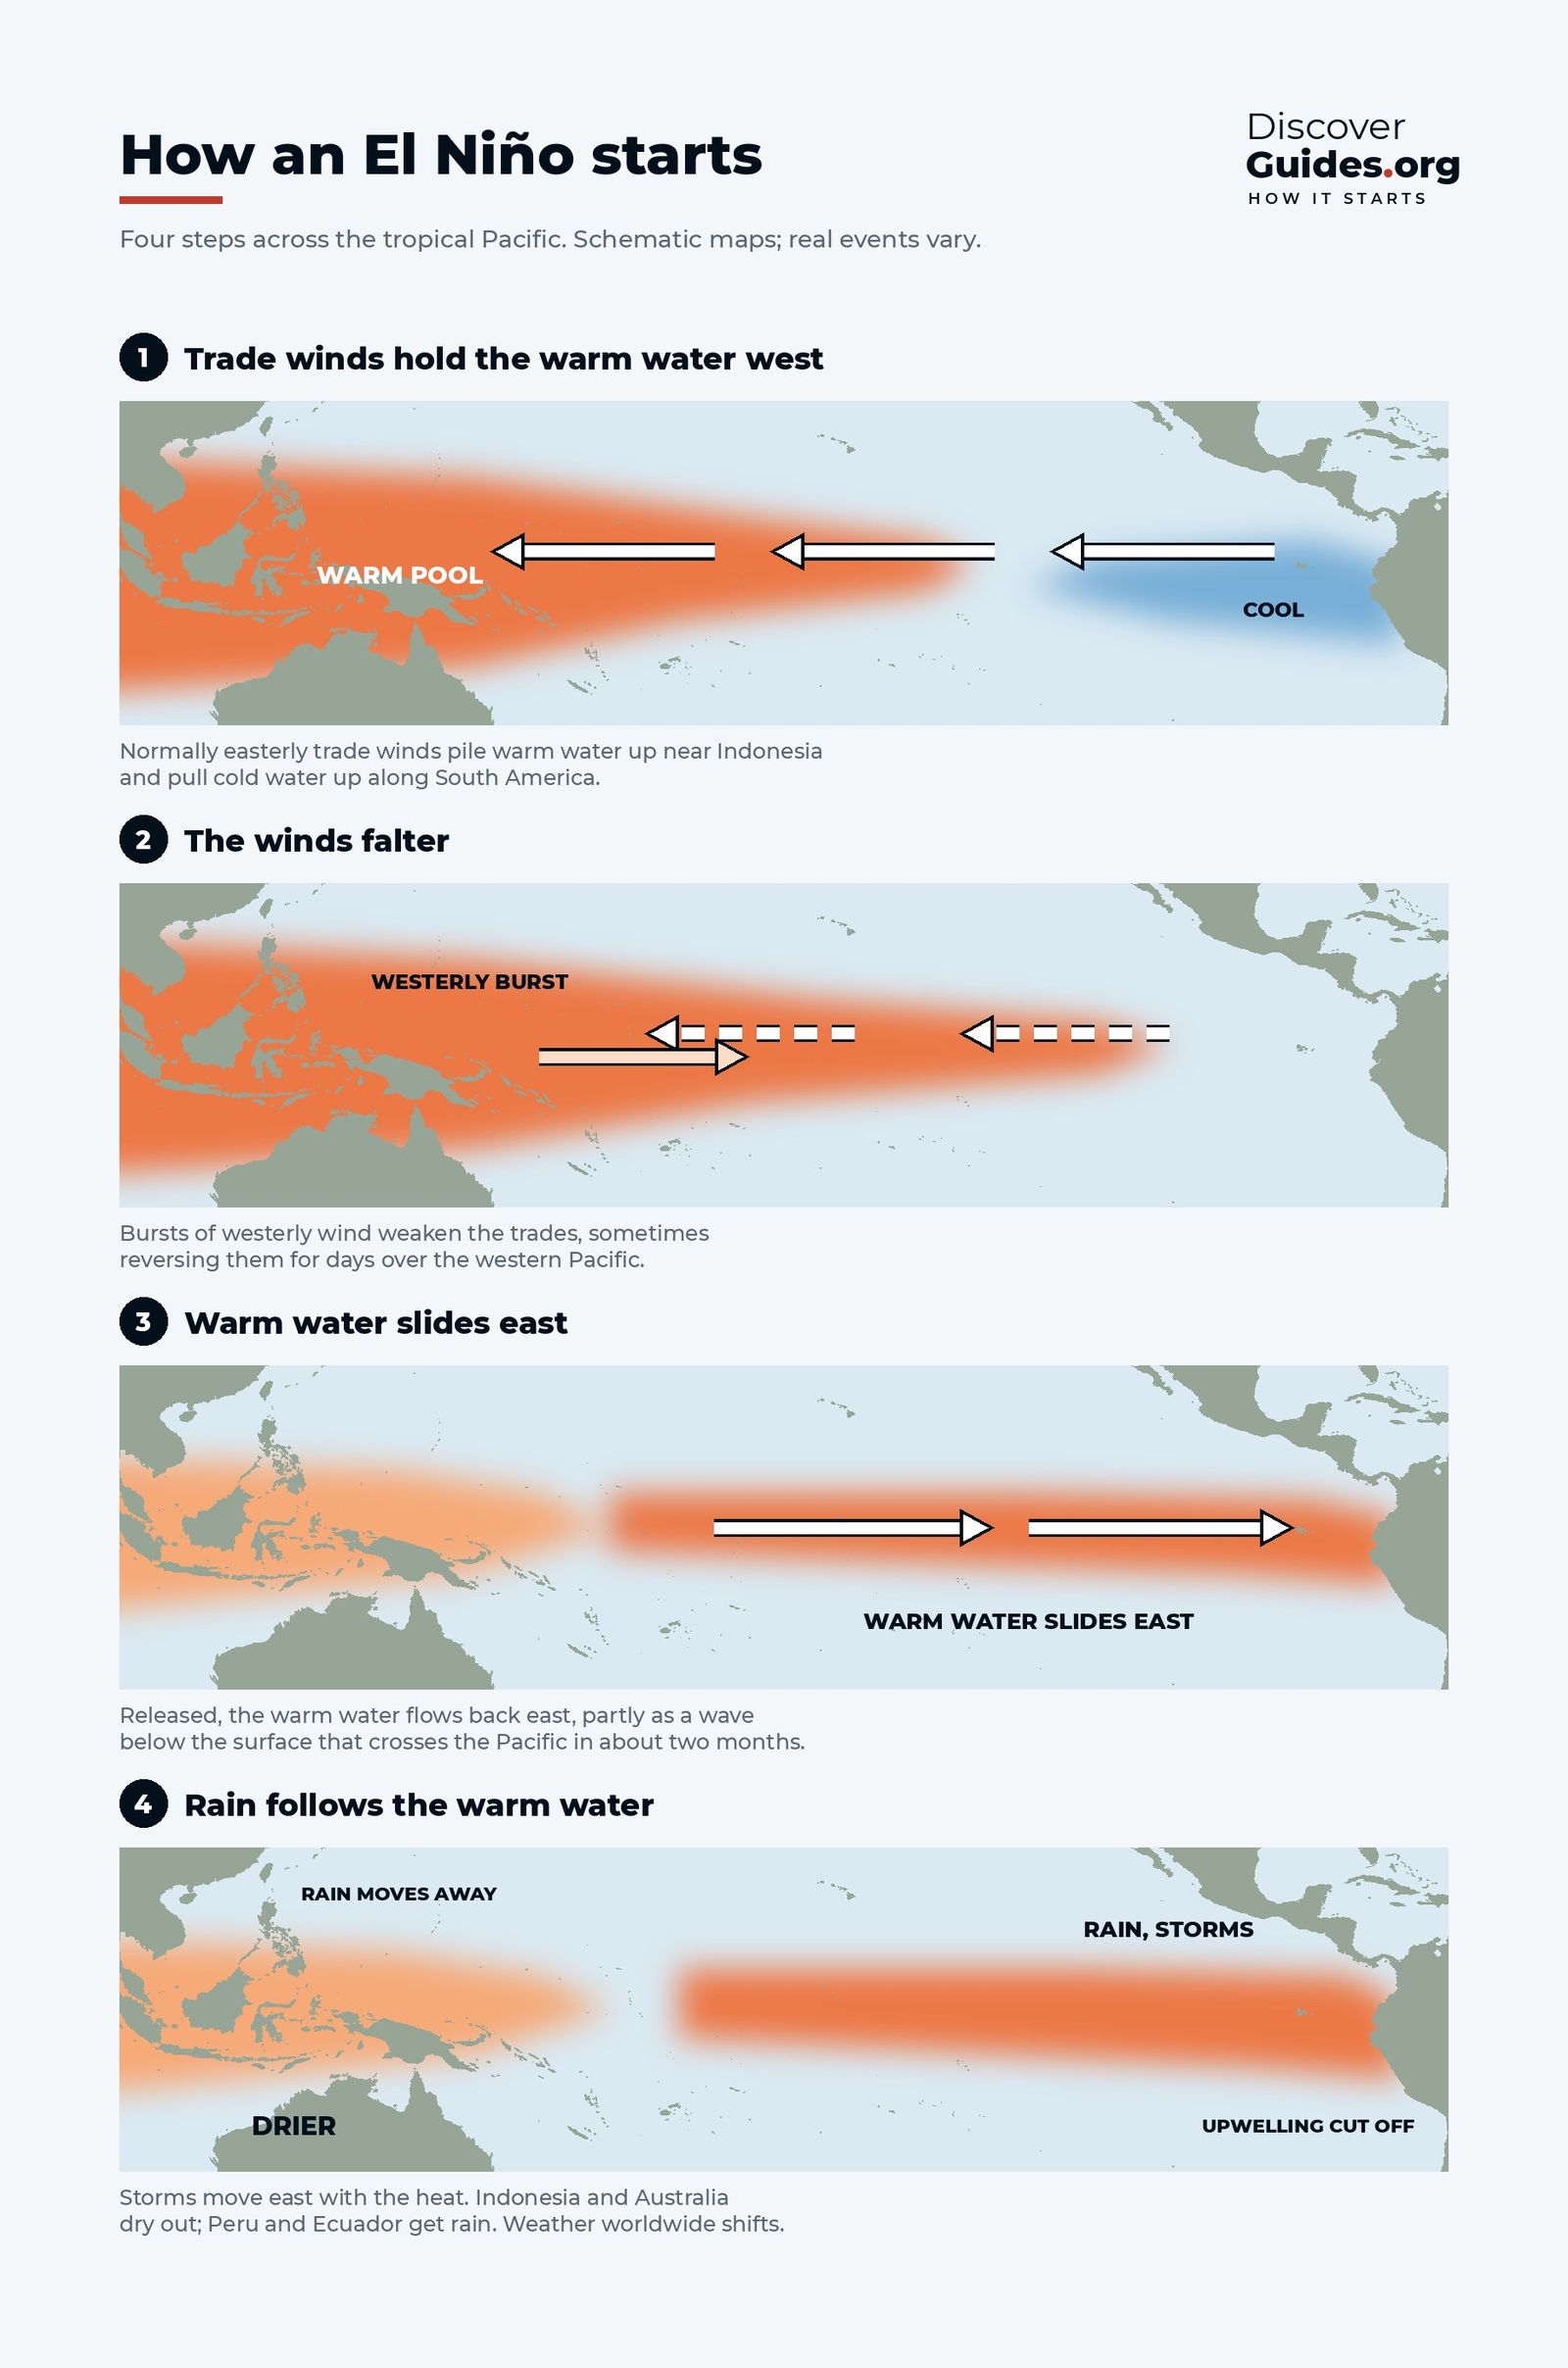
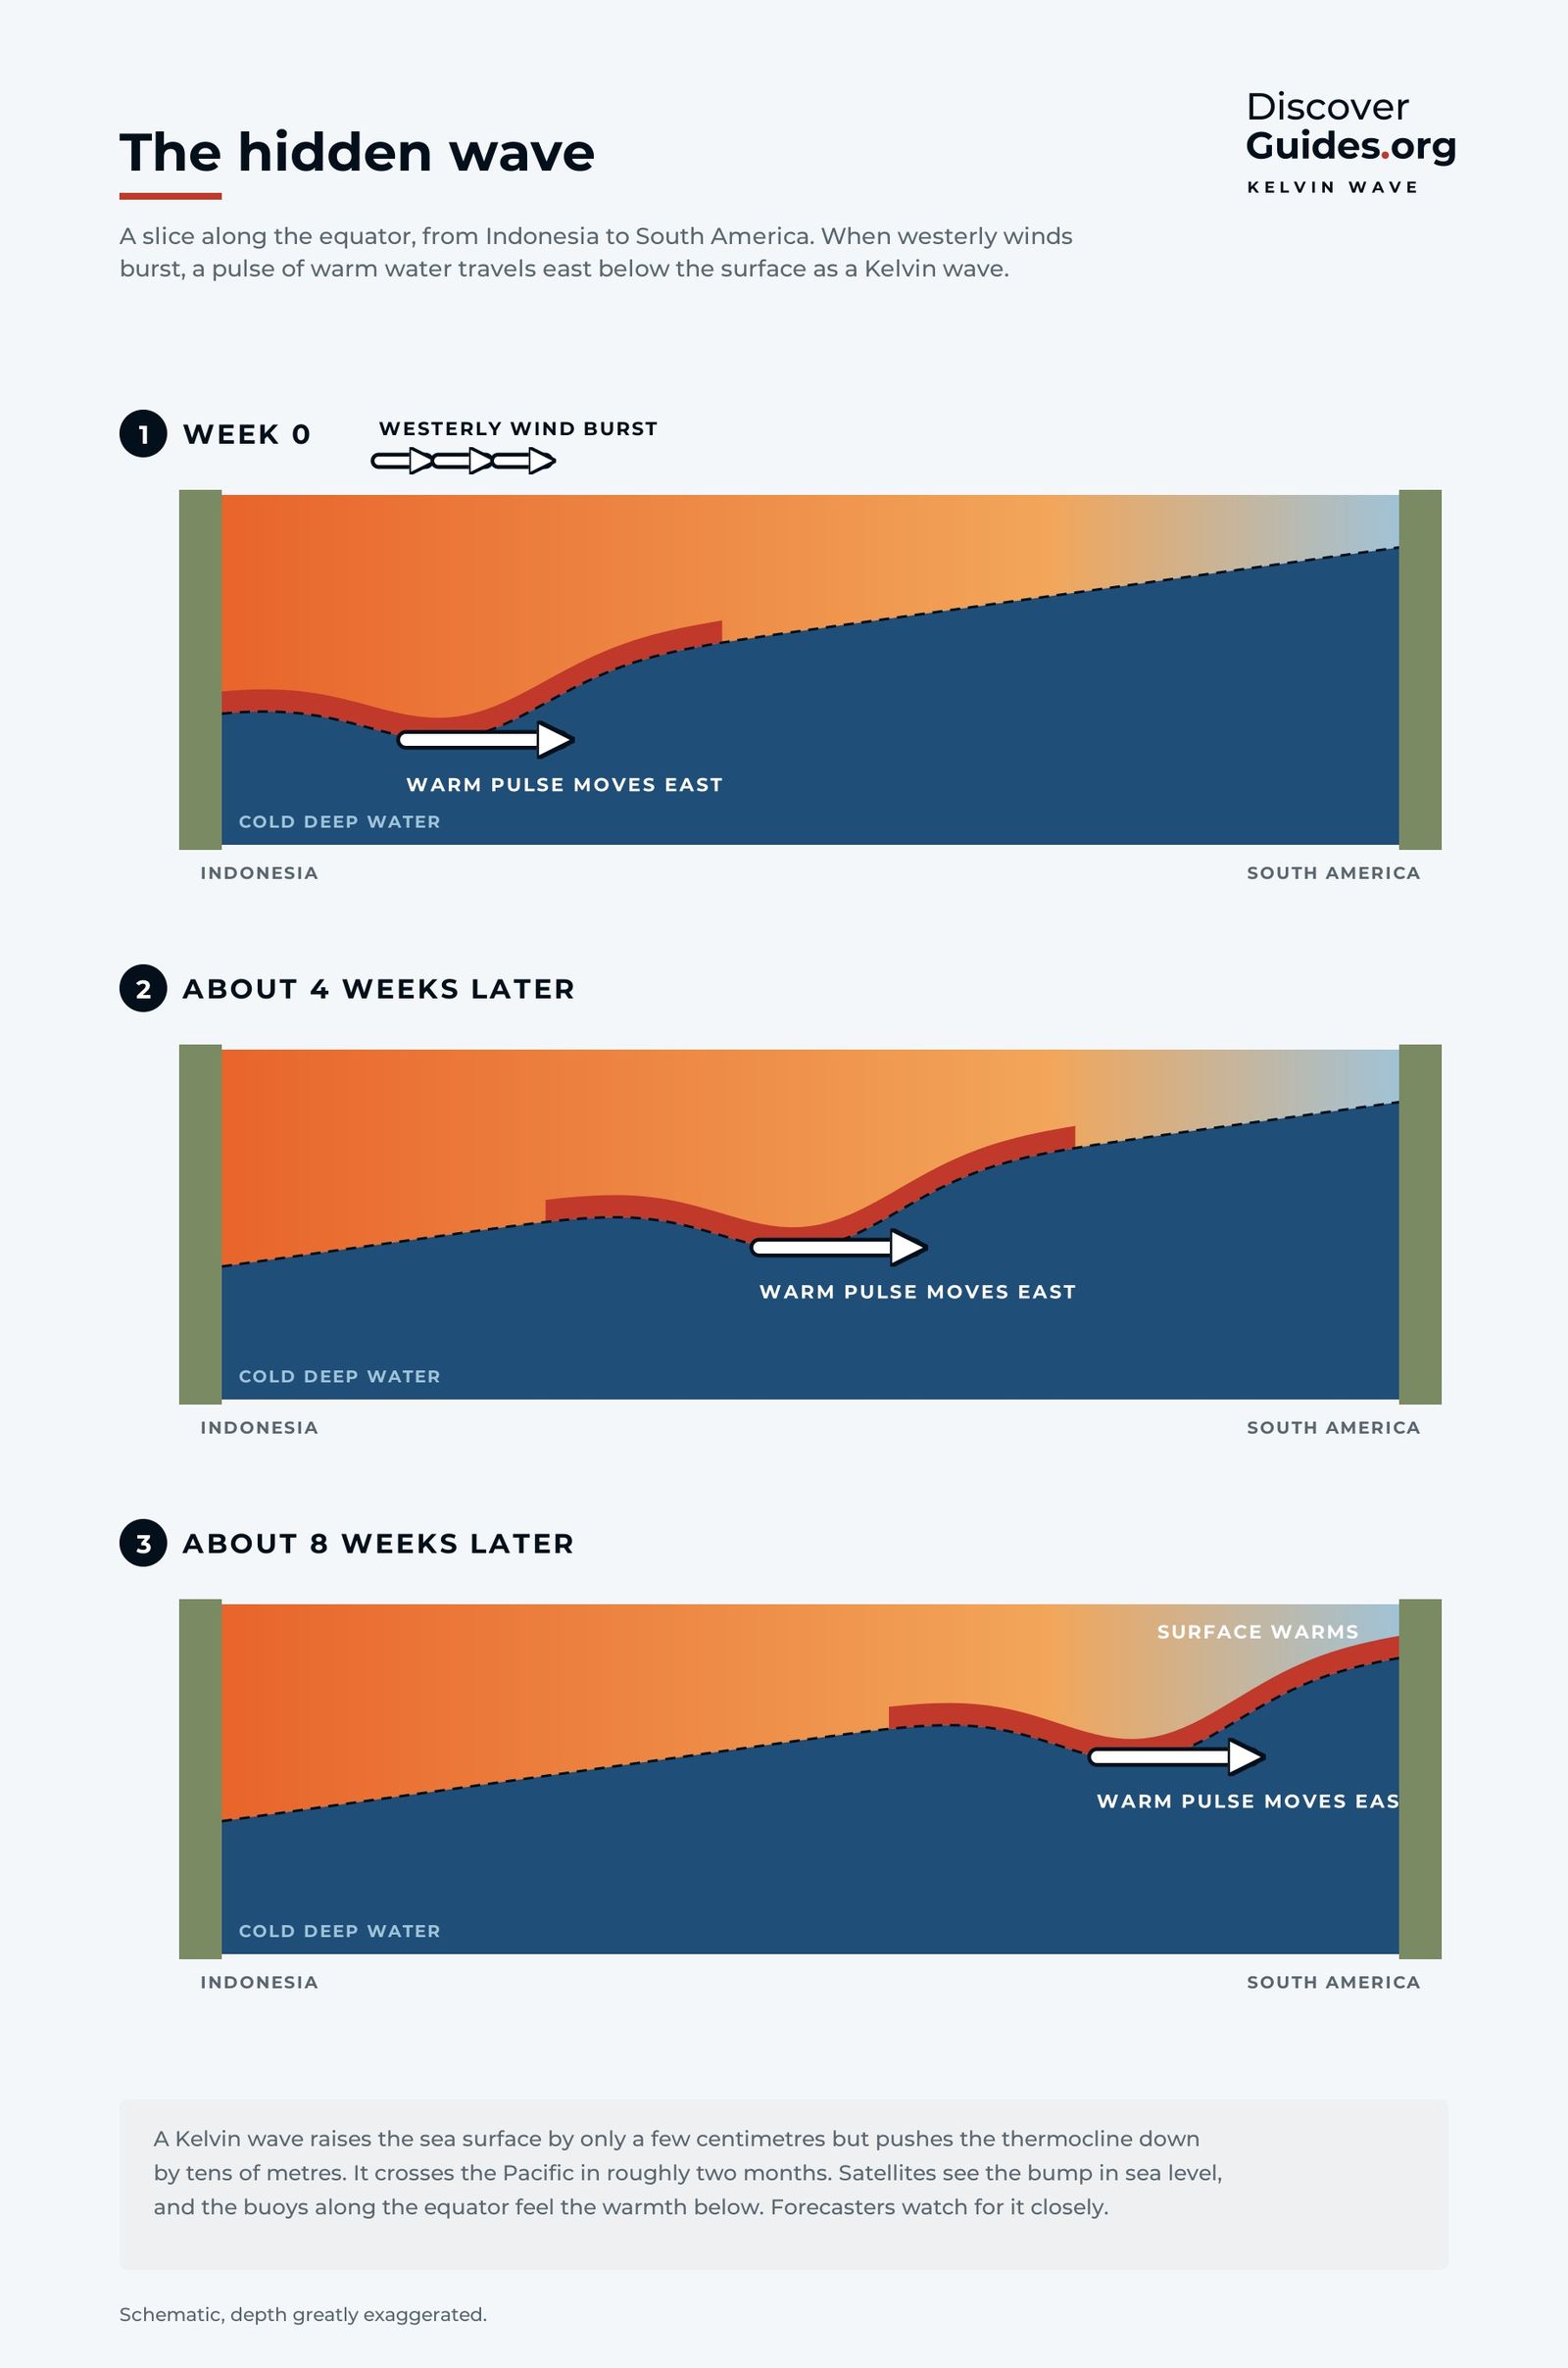
How an El Niño starts: faltering trade winds, westerly wind bursts, a hidden Kelvin wave crossing the Pacific, and the feedback loop that makes it grow.
 El Niño basics
The Southern Oscillation
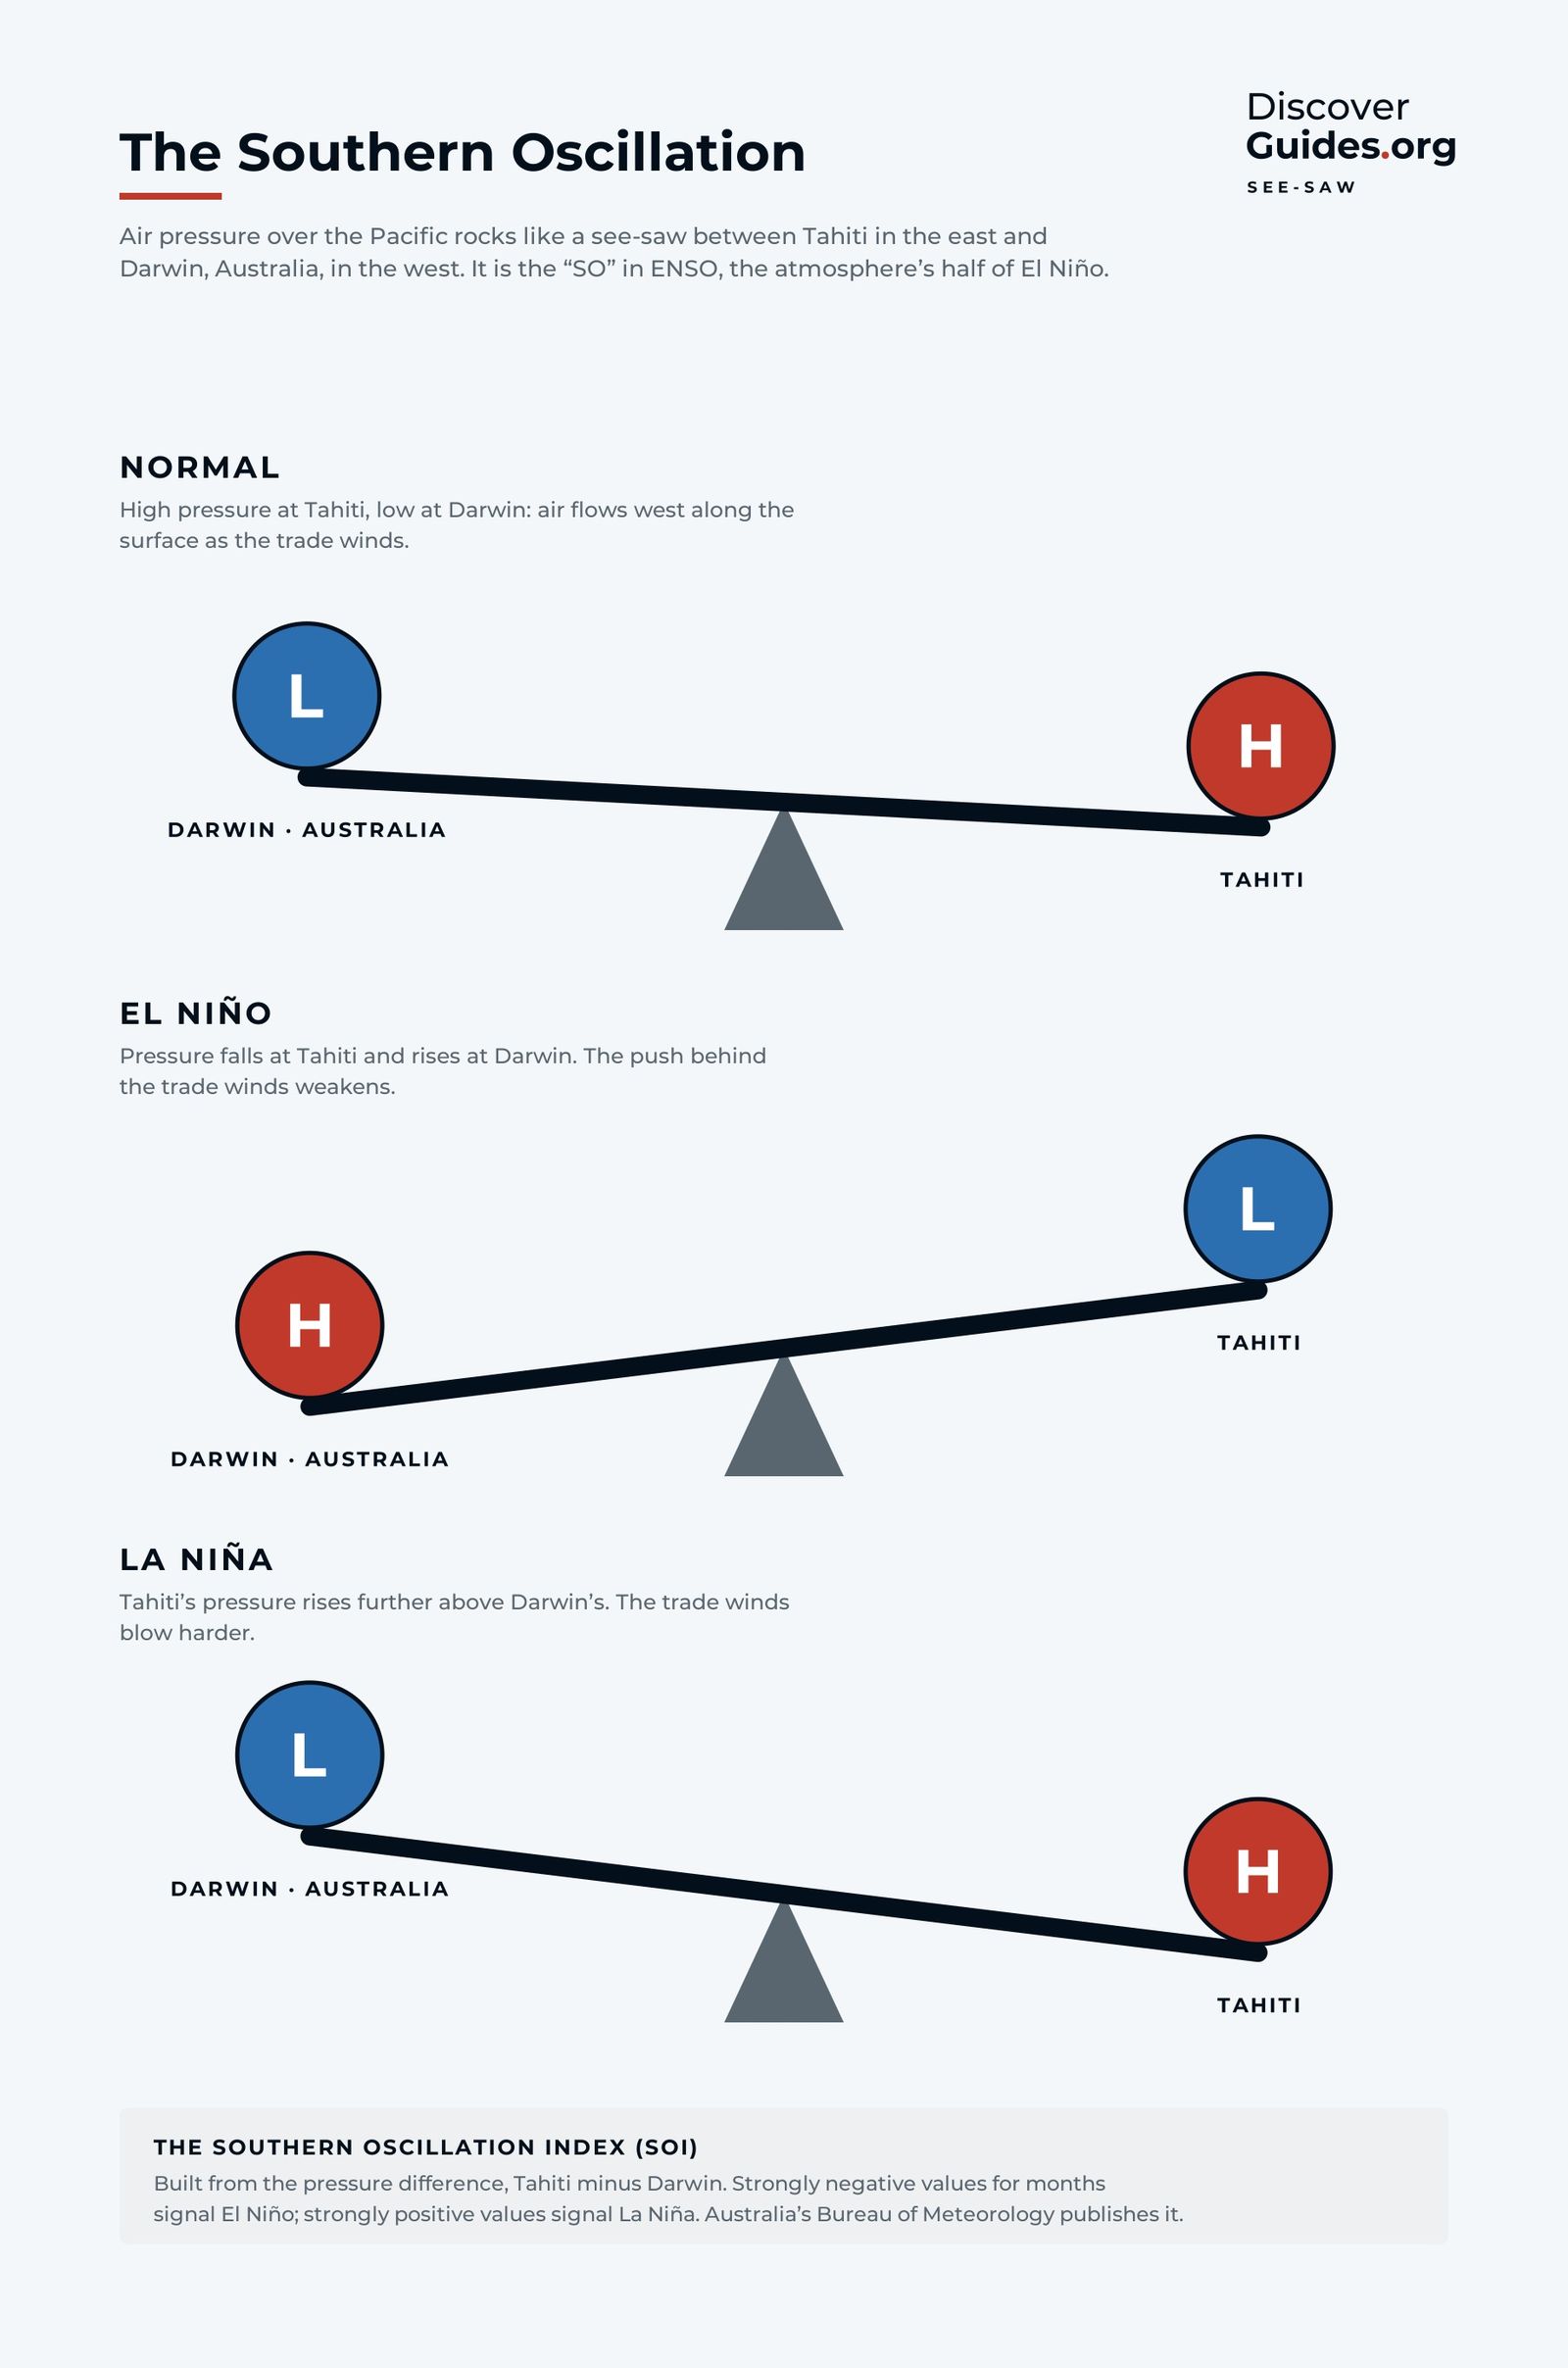
The Southern Oscillation explained: how air pressure at Tahiti and Darwin rocks like a see-saw, how the SOI is calculated, and how it reveals El Niño.
 Weather
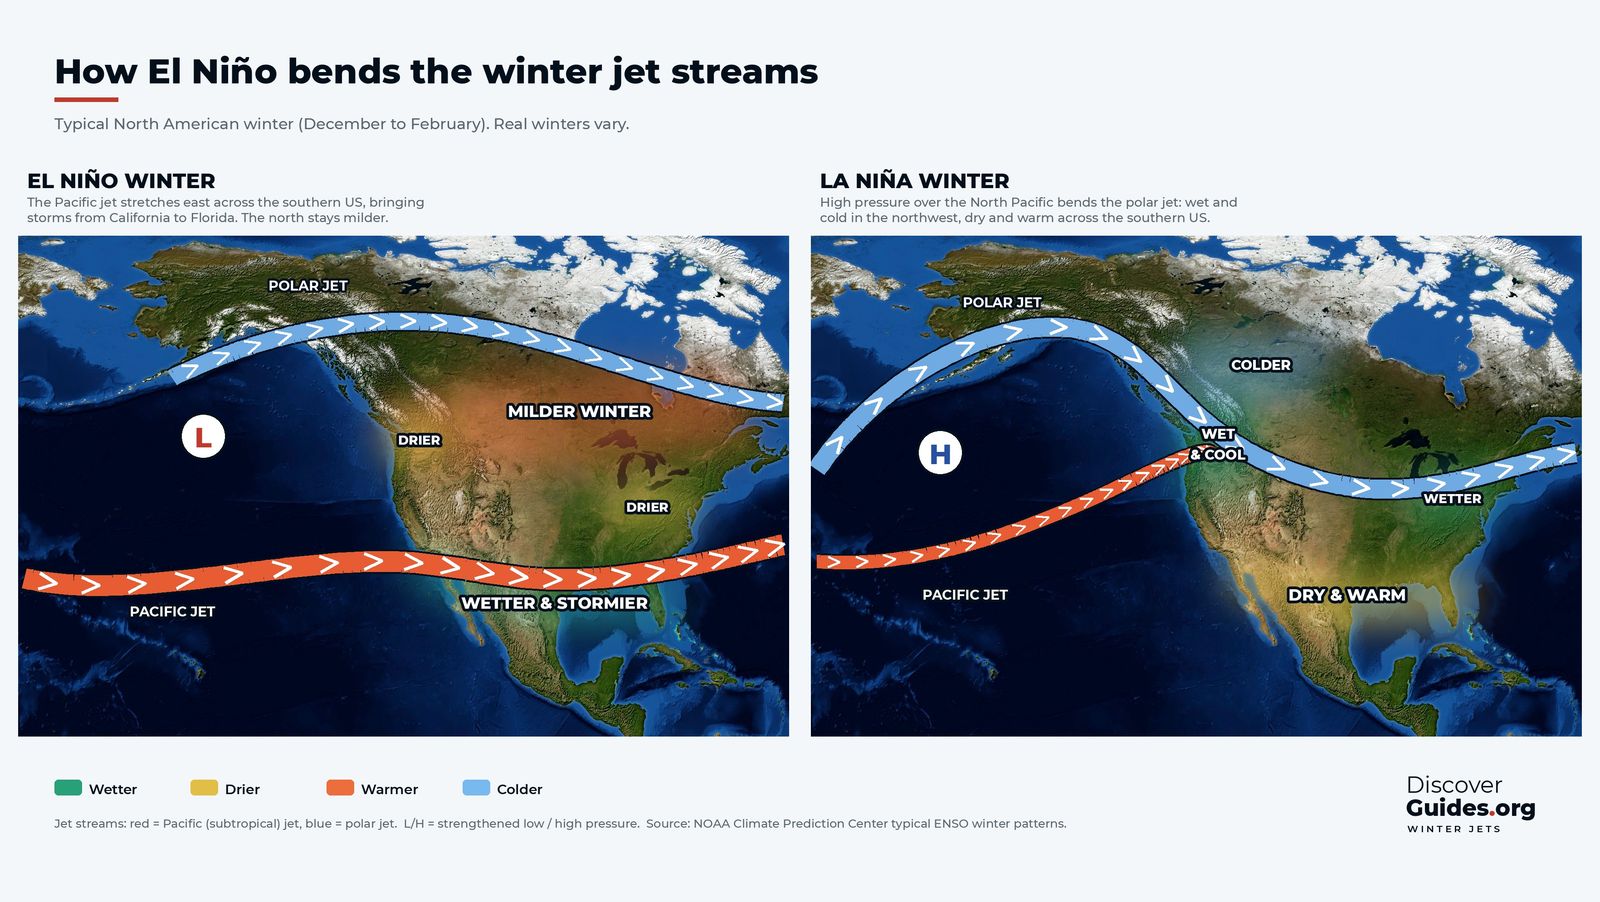
El Niño and the jet stream
How El Niño bends the jet stream: why warm water in the tropical Pacific stretches the Pacific jet across the southern US and steers its winter storms.
WeatherThe planet's wind belts
How Earth's winds work: Hadley, Ferrel and polar cells, where the trade winds, westerlies, ITCZ and jet streams come from, and how El Niño fits into it all.
 Weather
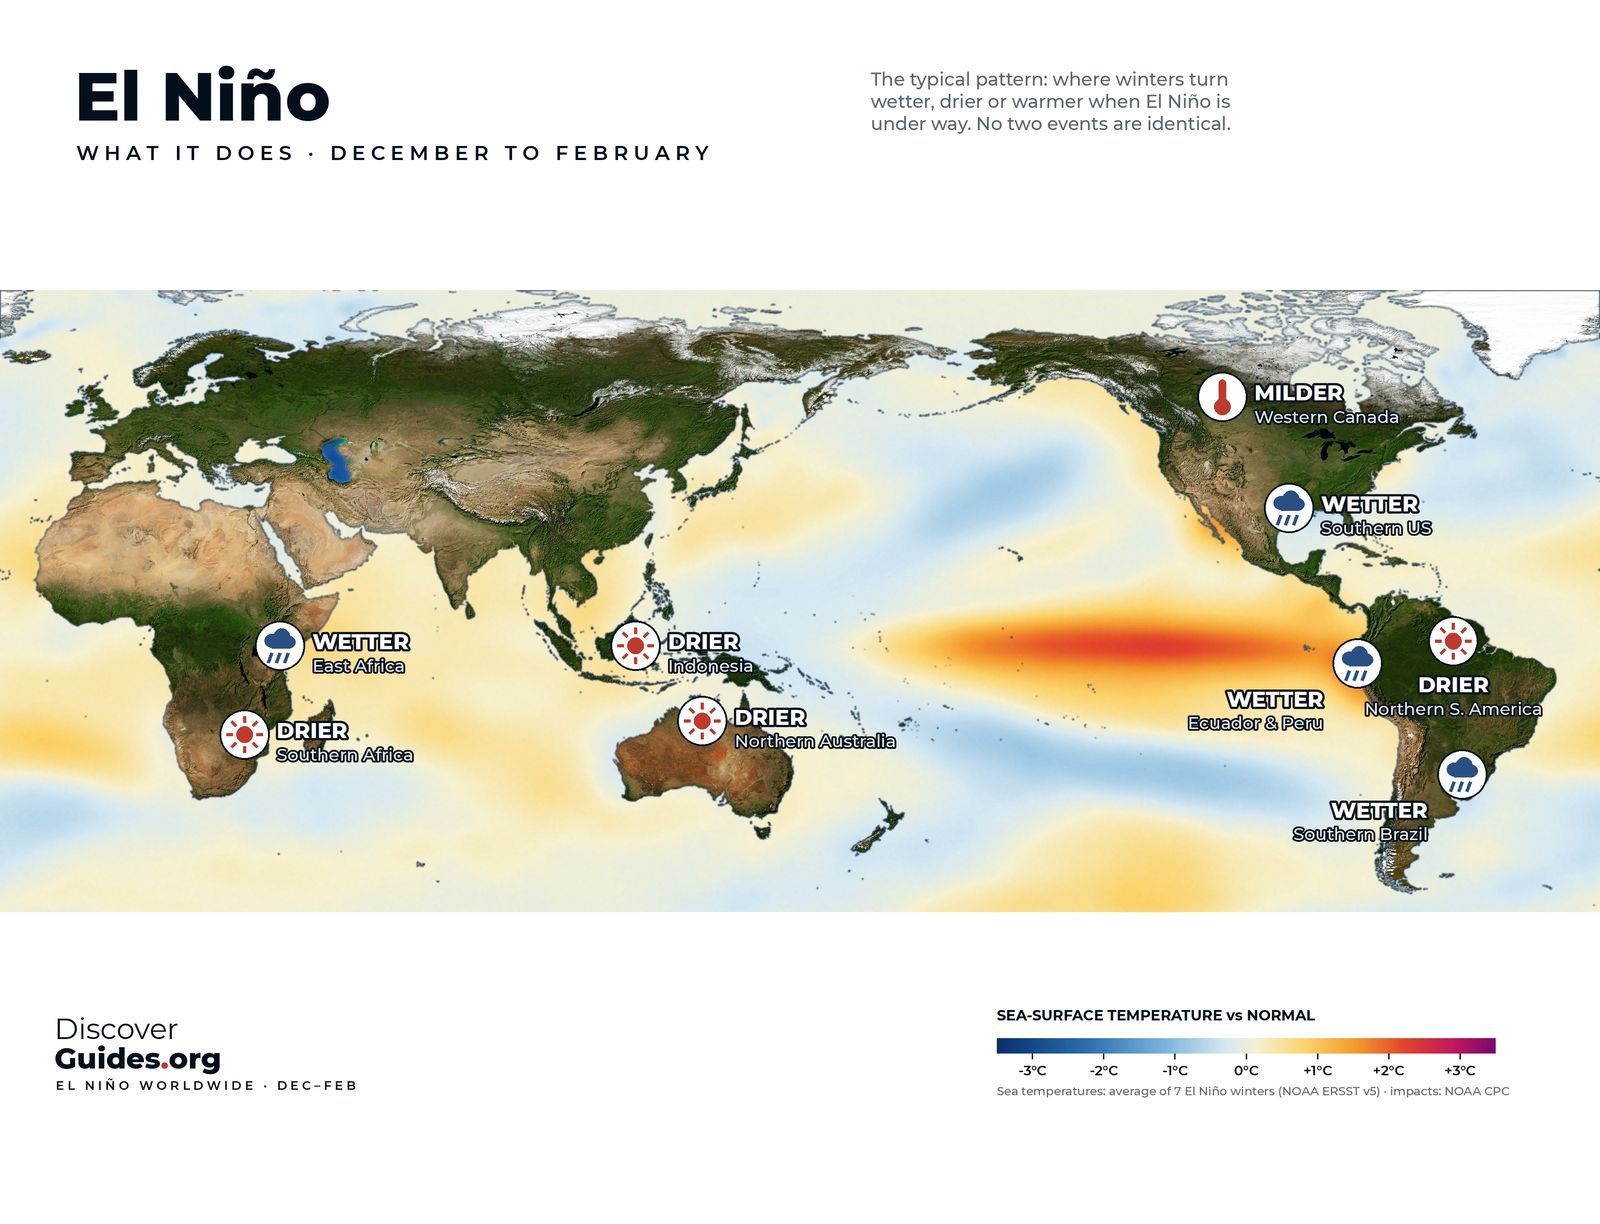
El Niño weather around the world
El Niño's weather around the world, season by season: who usually gets wetter, drier or milder in December-February and in June-August, and why it varies.
 2026-27 event
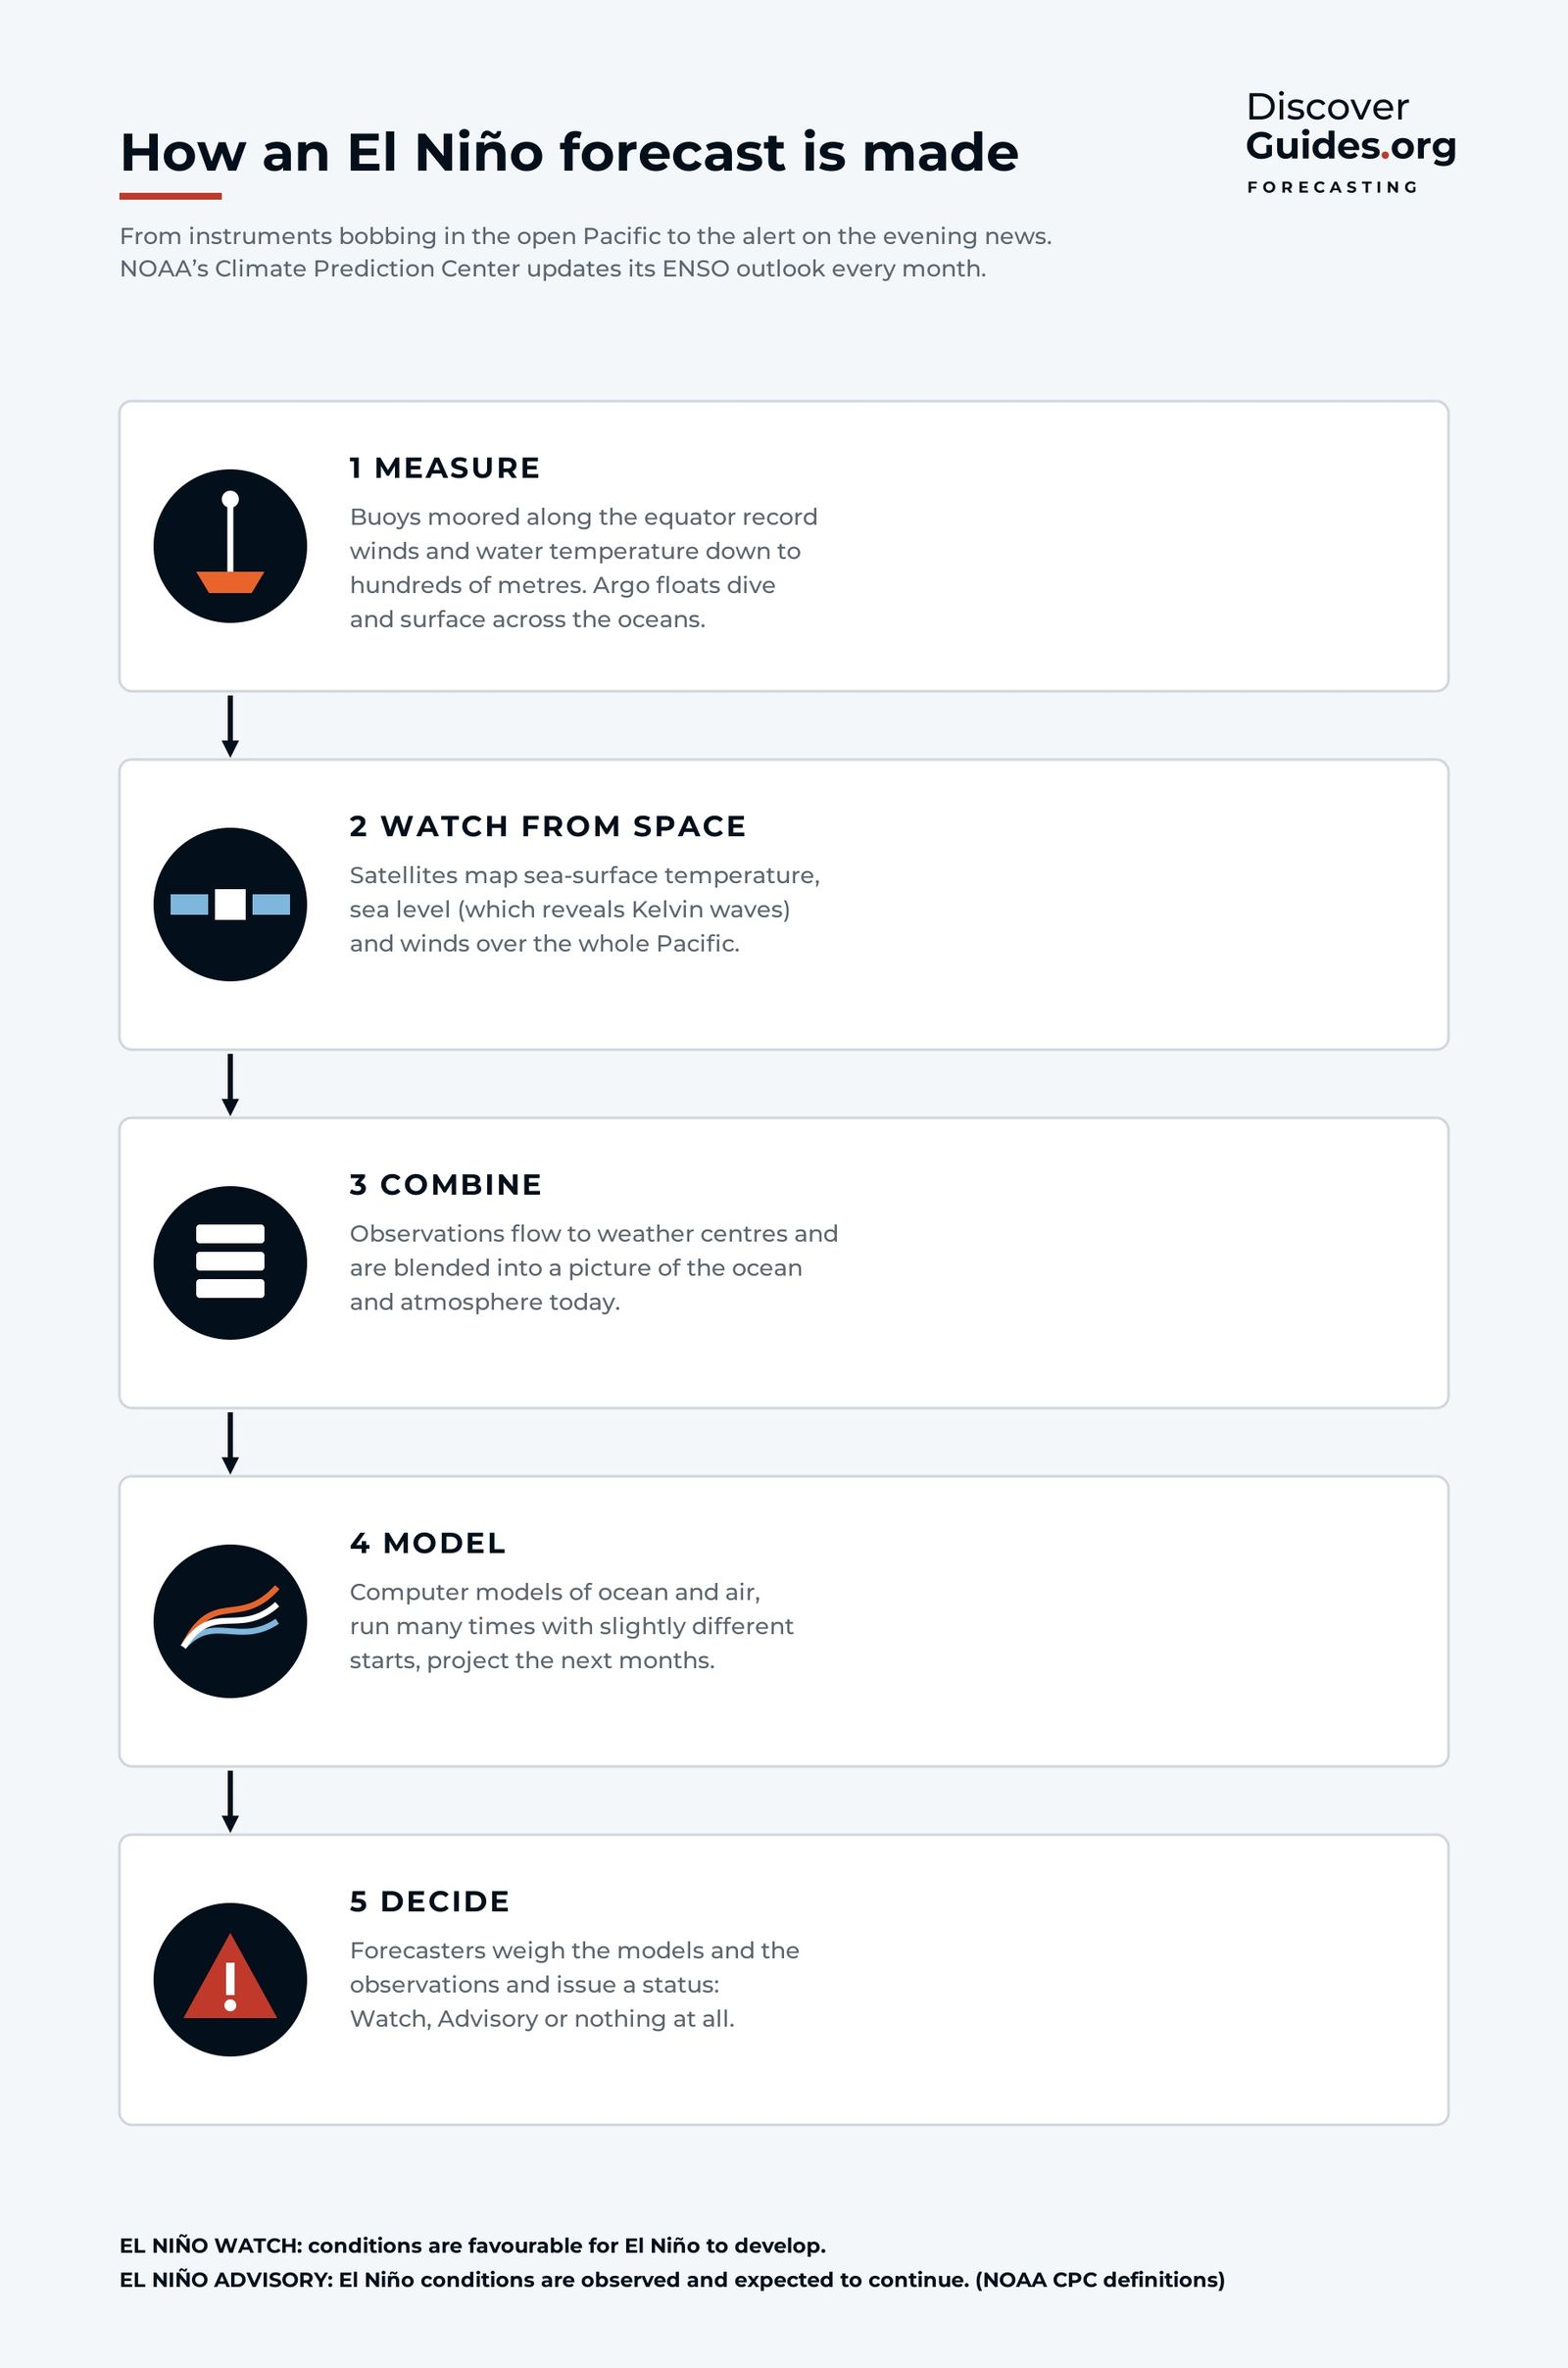
How El Niño forecasts work
How El Niño forecasts are made, from Pacific buoys and satellites to computer models, and how to read NOAA's monthly ENSO updates, Watches and Advisories.
 History
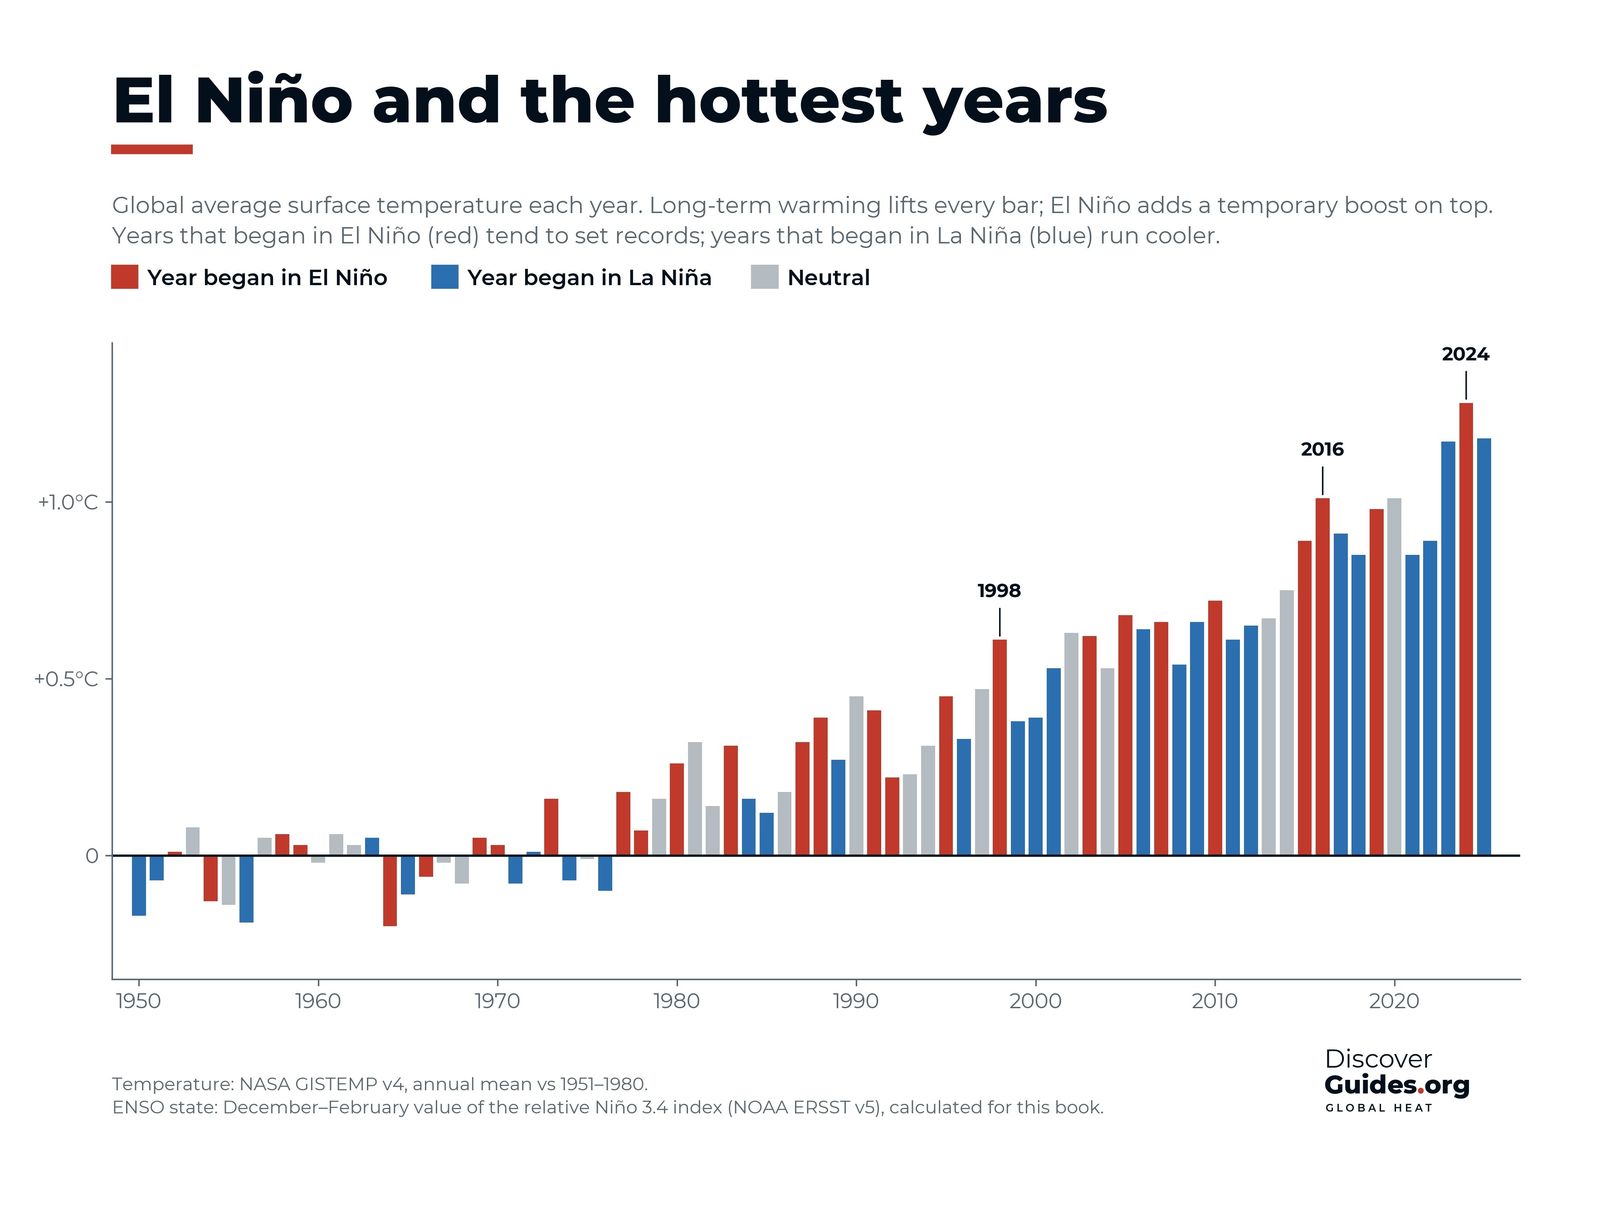
El Niño and global temperature
Does El Niño cause record heat? How El Niño lifts global temperature for a while, why 1998, 2016 and 2024 set records, and what 2026-27 could bring next.
 History
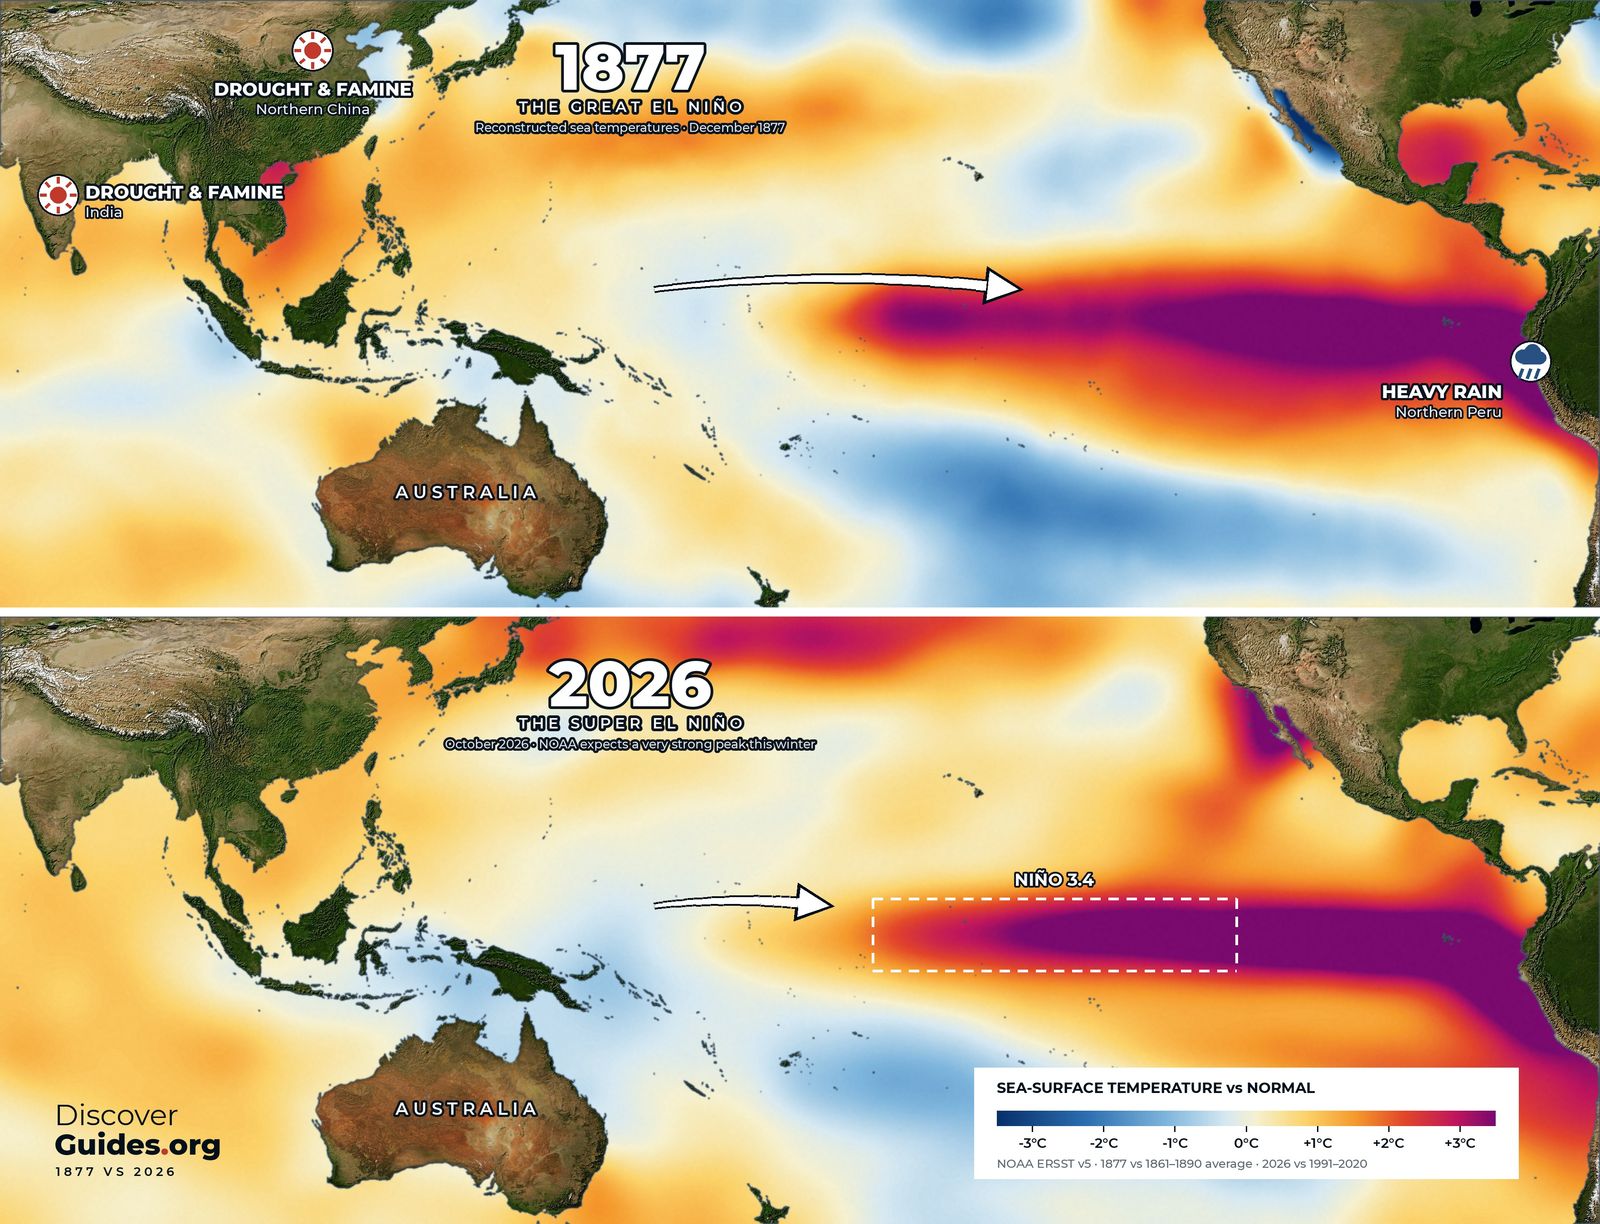
The Great El Niño of 1877-78
The Great El Niño of 1877-78 brought drought and famine to India, China and Brazil and killed tens of millions. What happened, why, and how 2026-27 compares.
 History
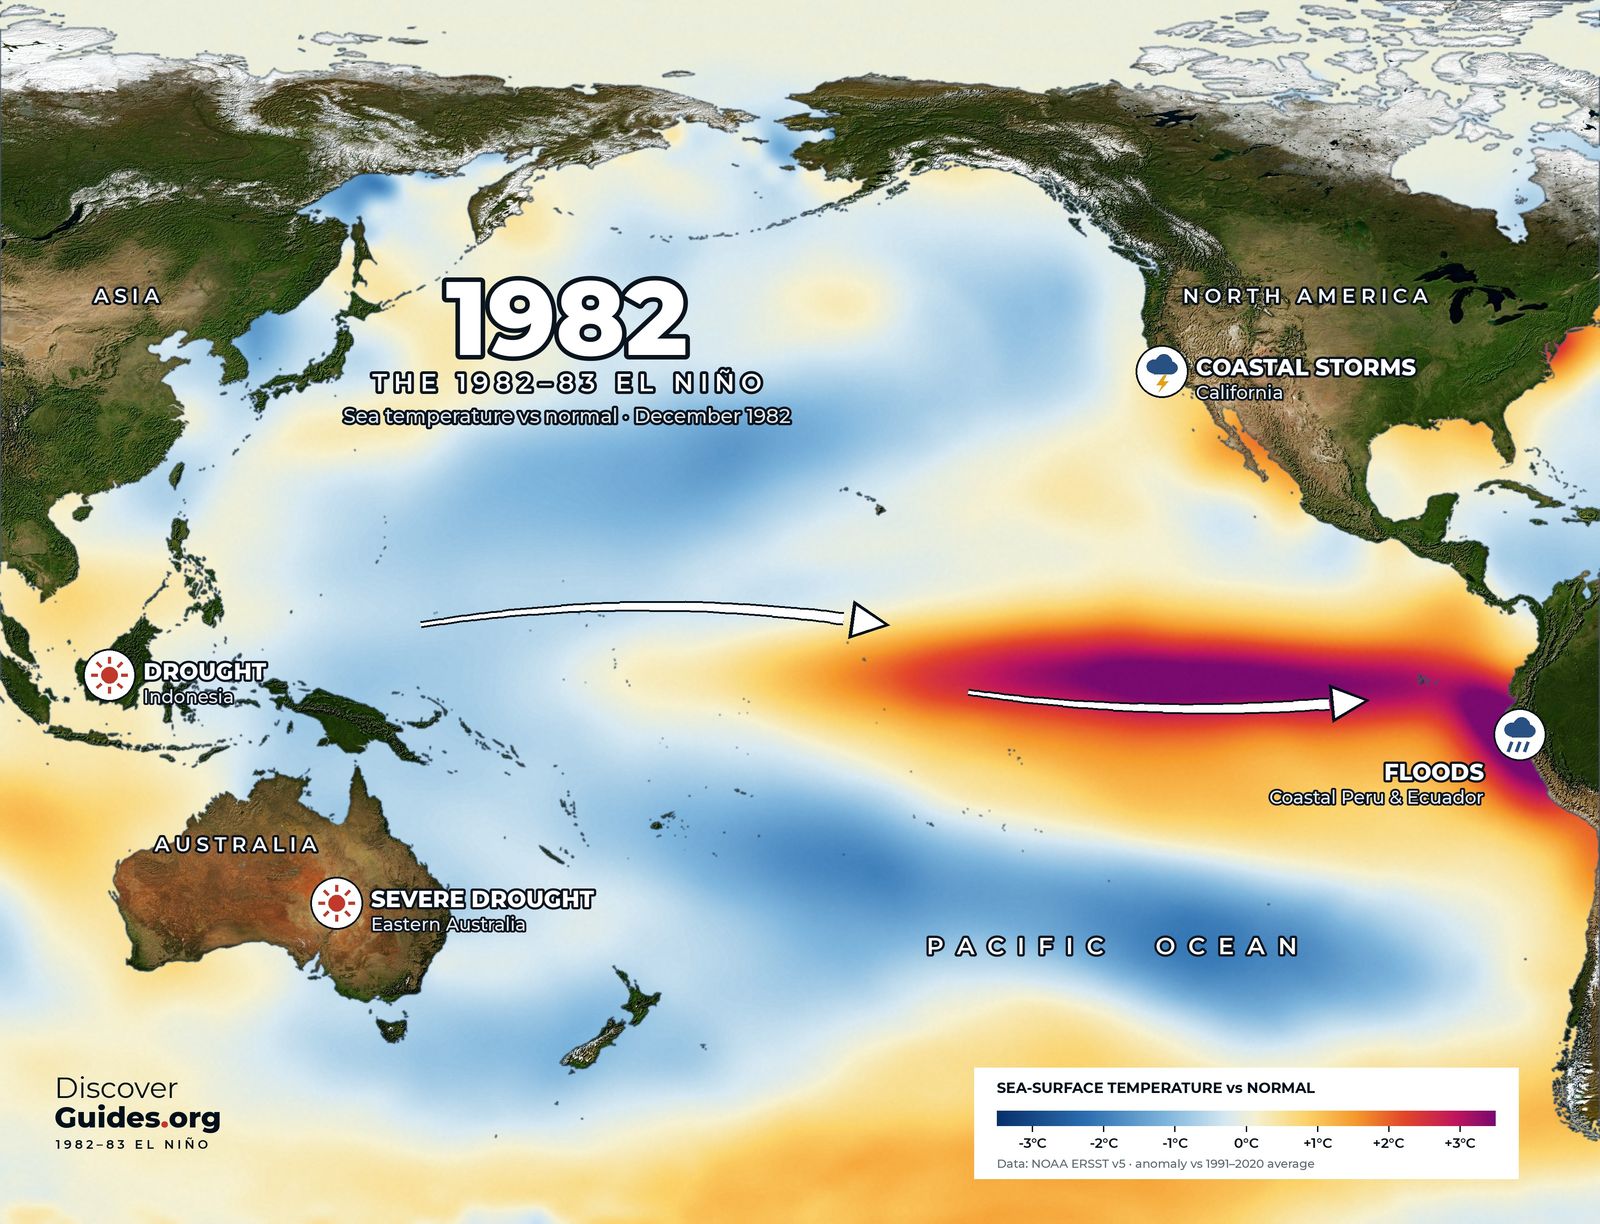
El Niño 1982-83
The 1982-83 El Niño was one of the strongest on record and nobody forecast it. How a volcano fooled satellites, its global impact and how it changed science.
 History
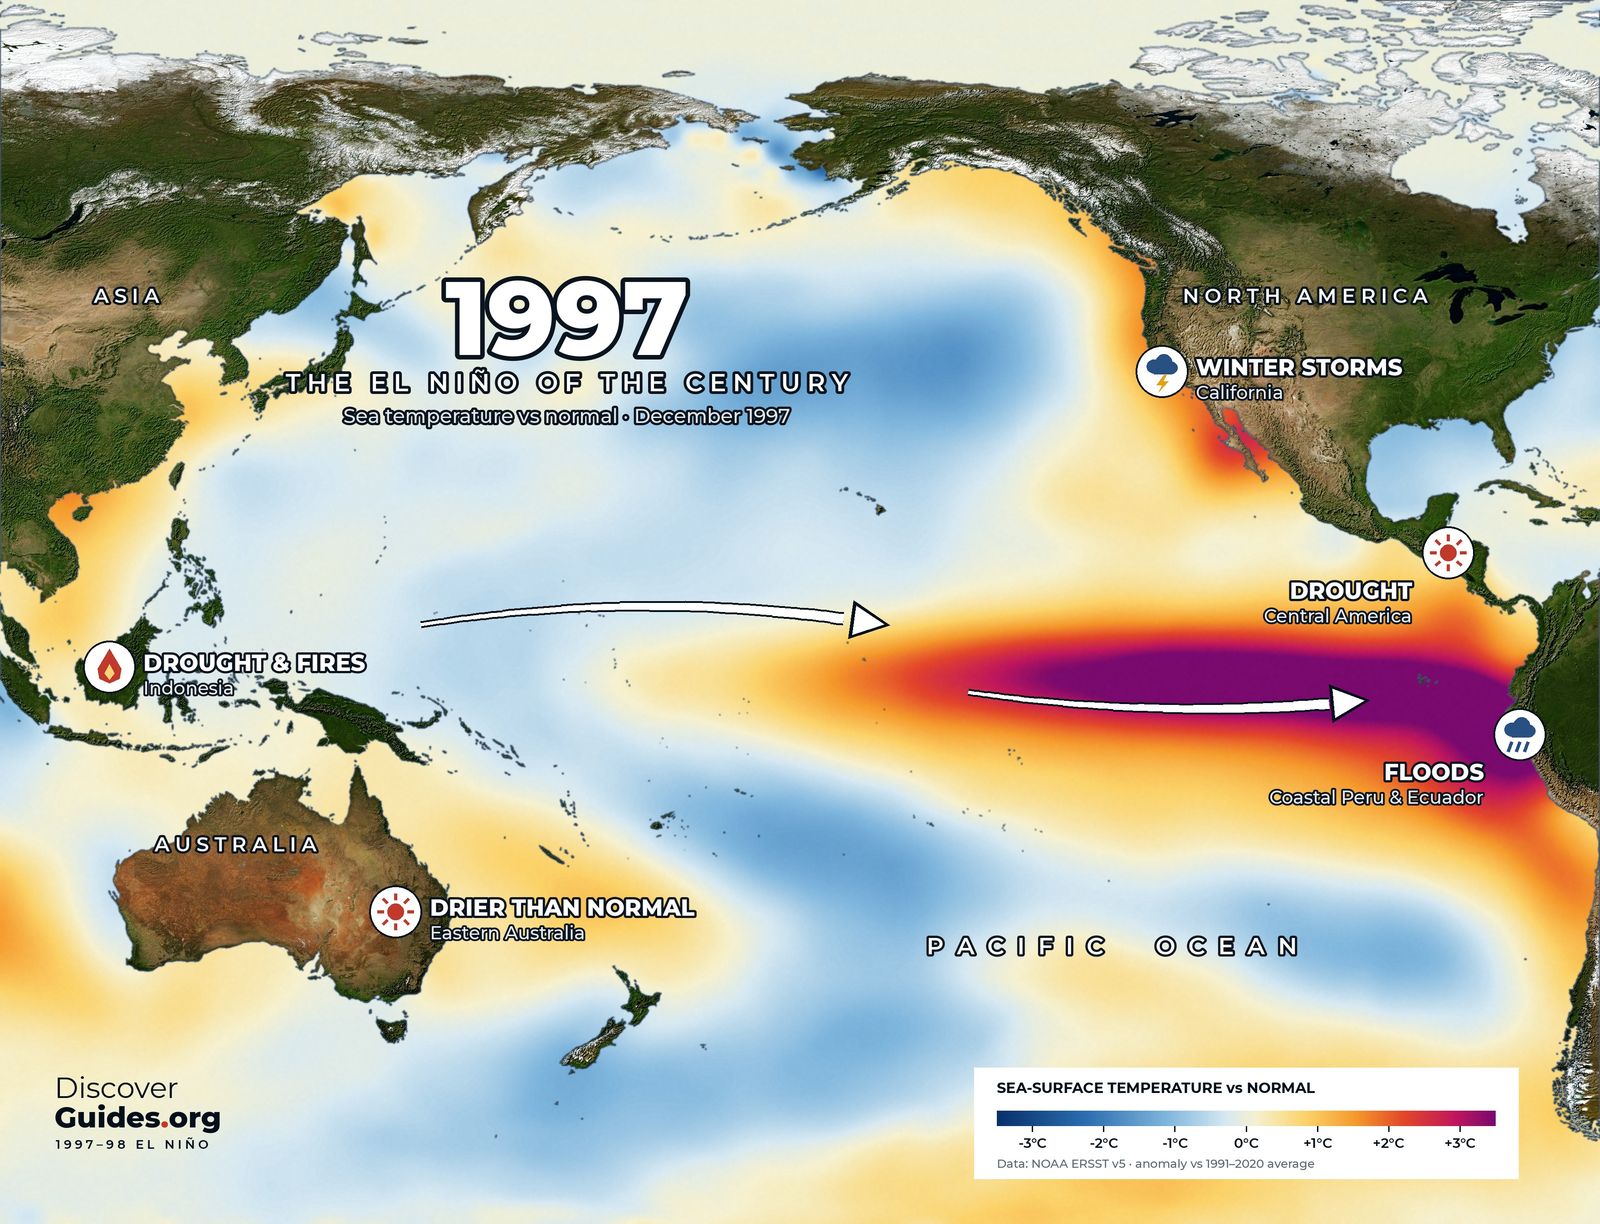
El Niño 1997-98
The 1997-98 El Niño was the first giant forecast months ahead. What it did, from Indonesia's fires and Peru's floods to the first global coral bleaching event.
 History
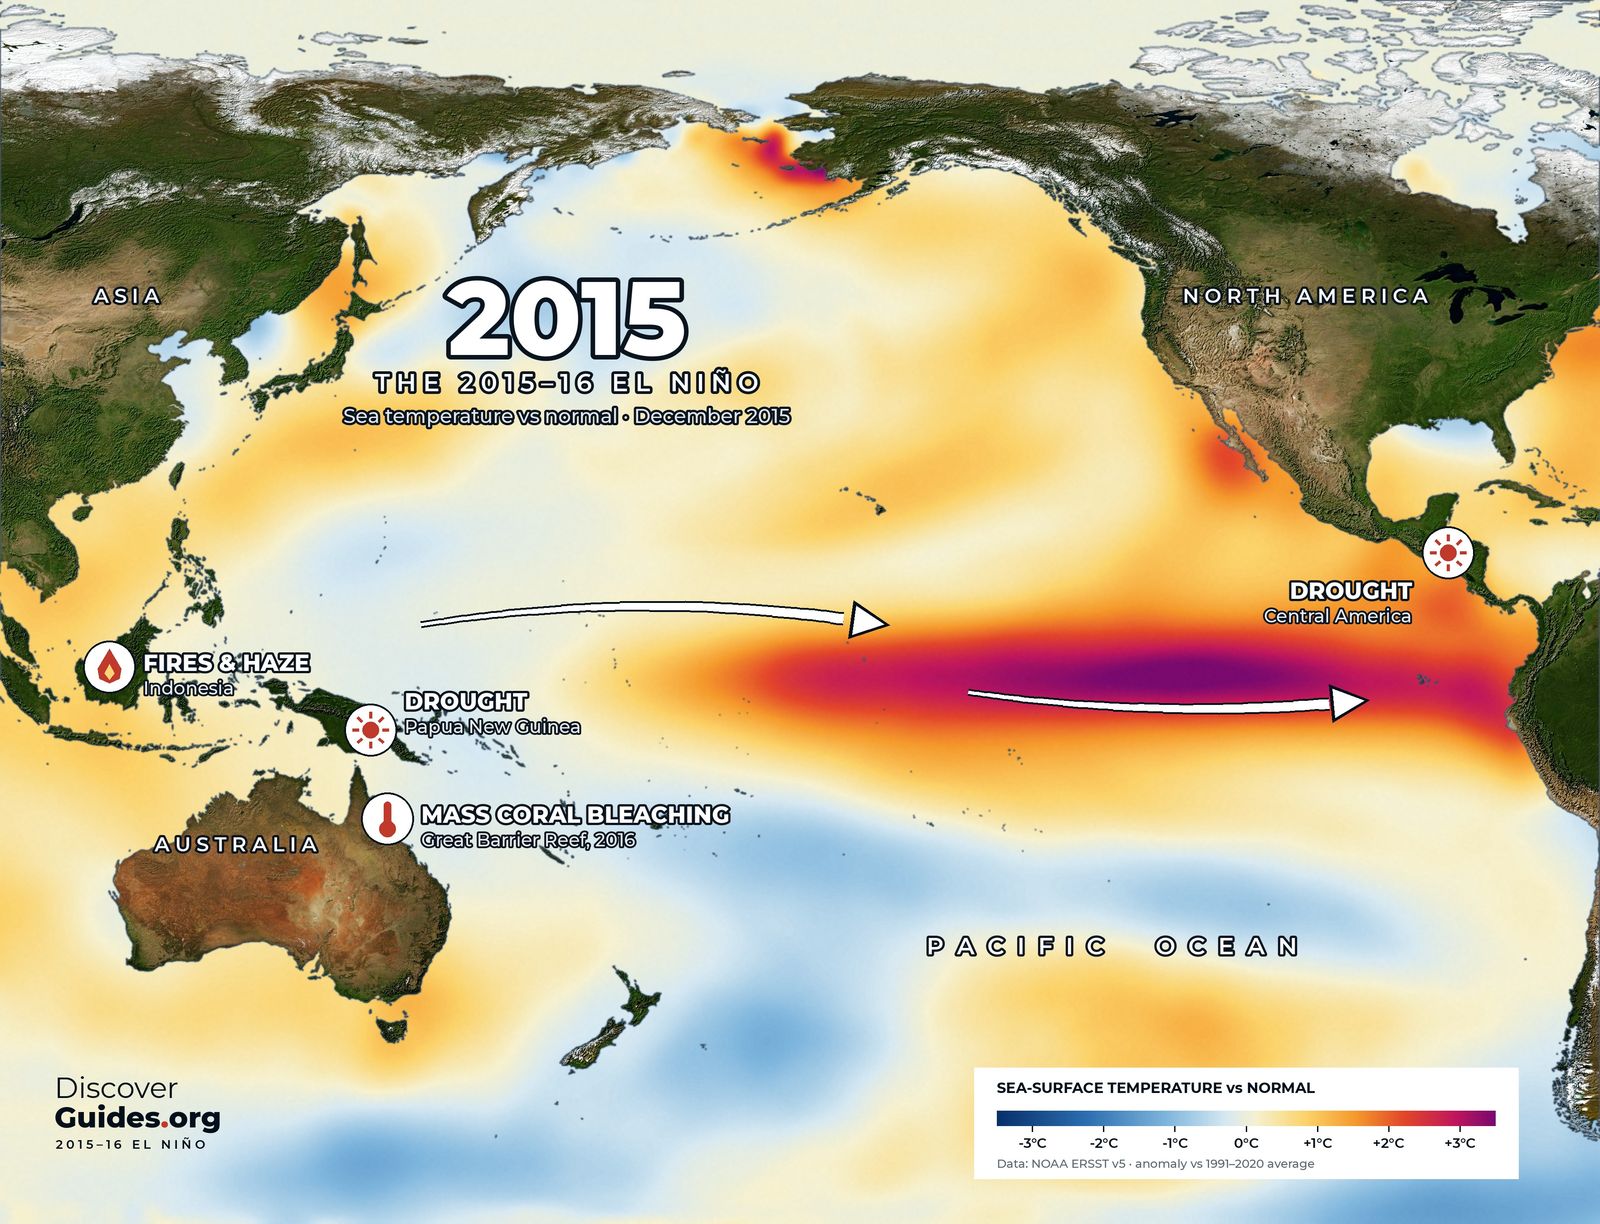
El Niño 2015-16
The 2015-16 El Niño set a record on NOAA's traditional index. Indonesia's fires, drought across the tropics, Great Barrier Reef bleaching and record heat.
 History
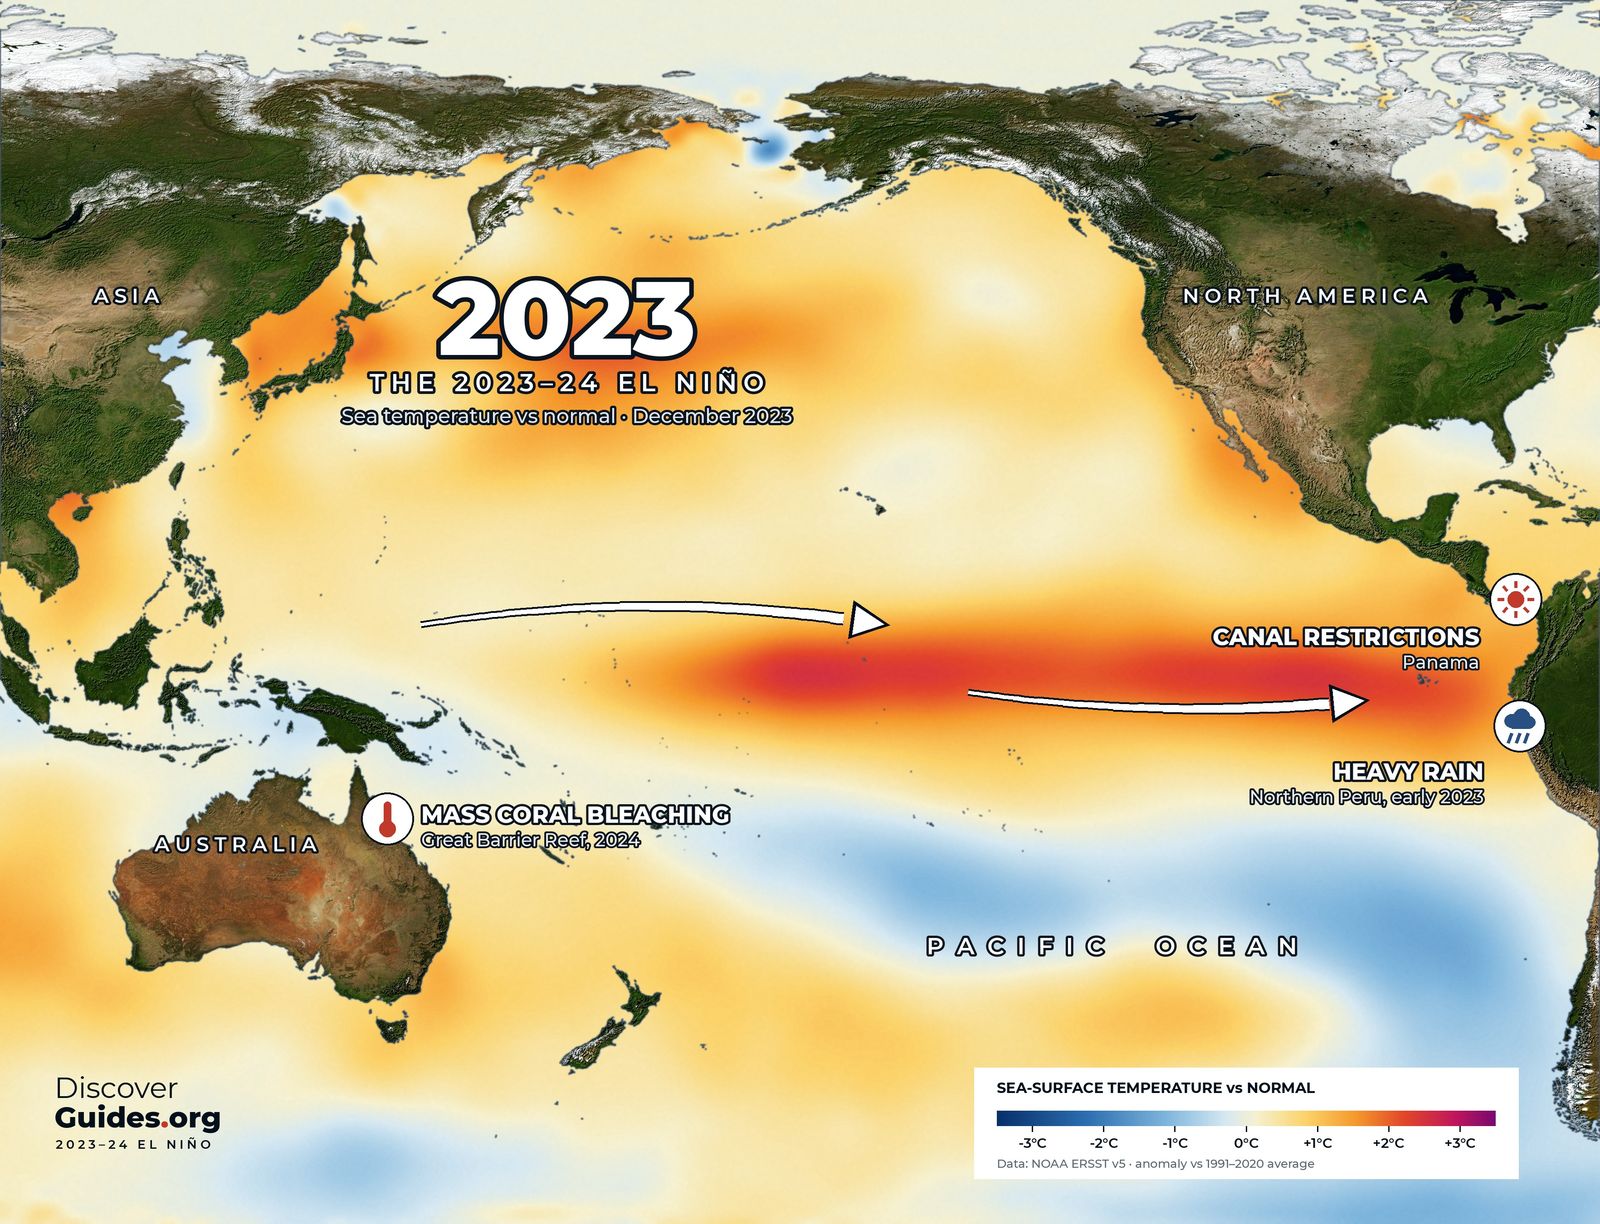
El Niño 2023-24
A strong but not record El Niño helped make 2023 and 2024 the hottest years on record. Panama Canal limits, Amazon drought and a global coral bleaching event.
 History
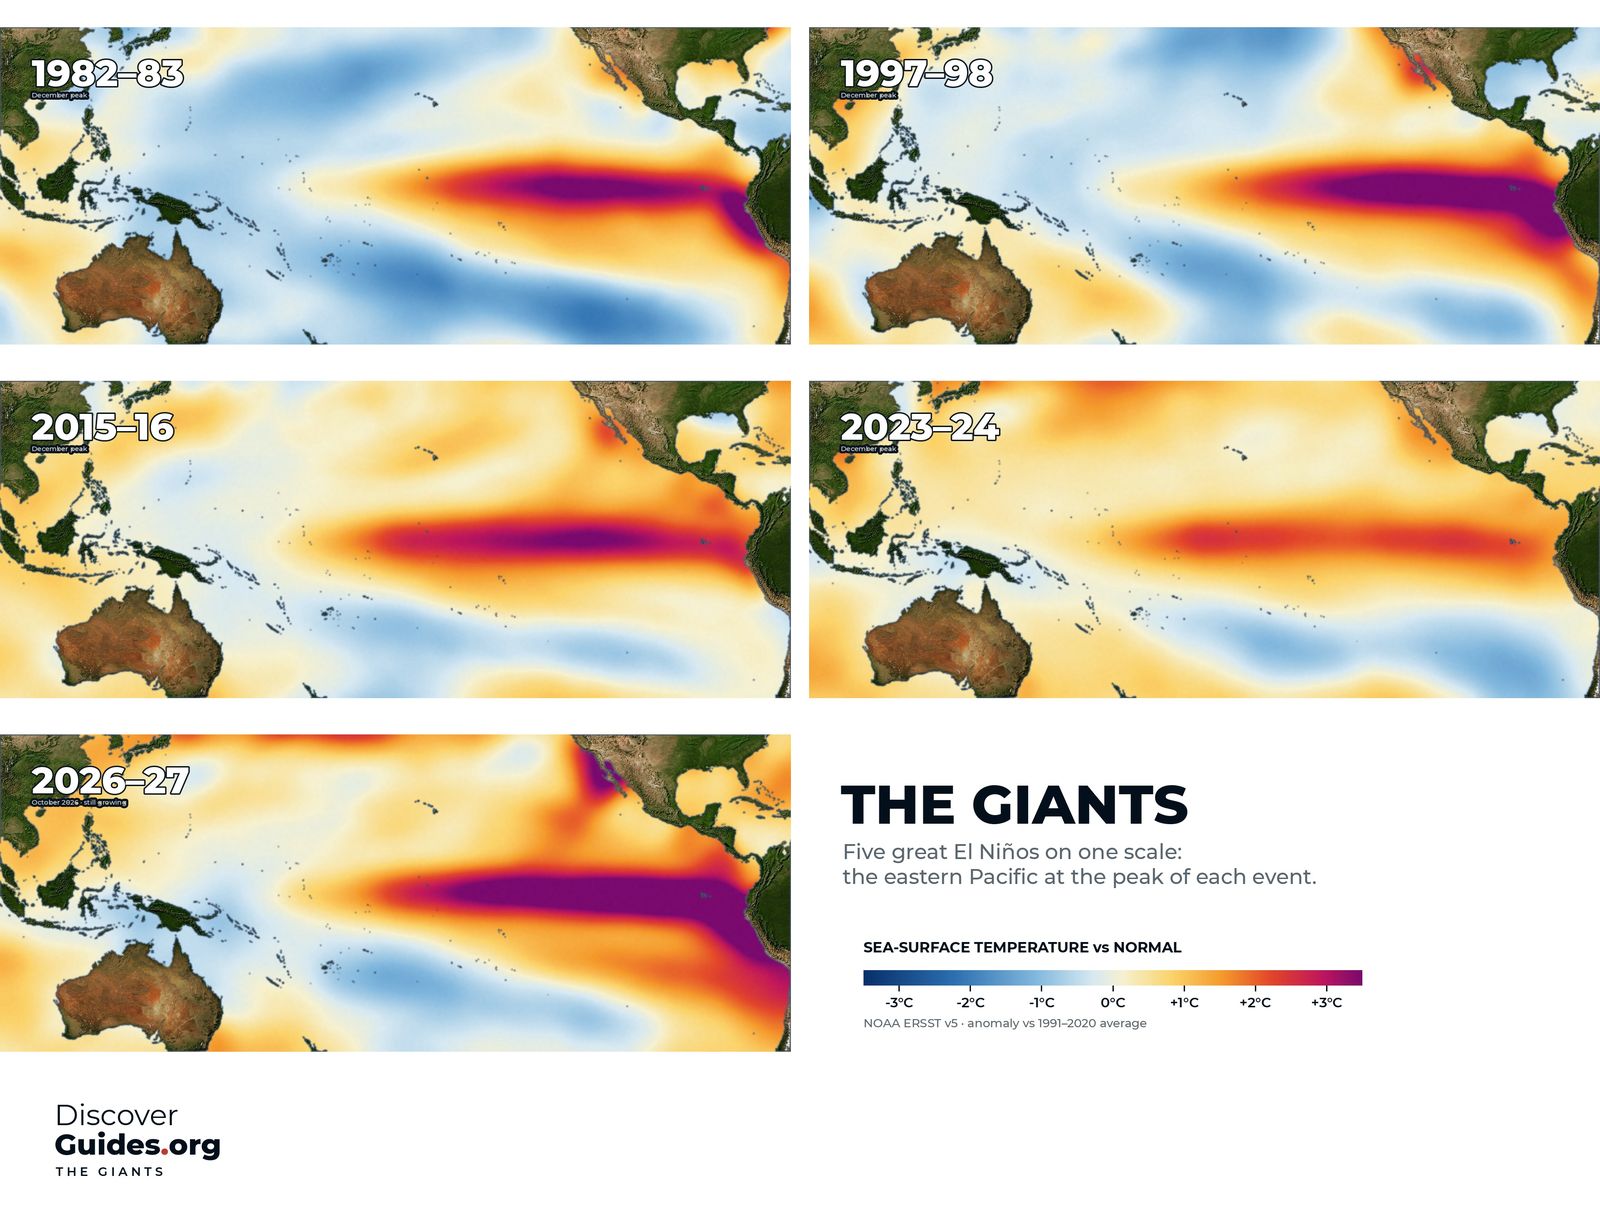
The strongest El Niños, ranked
Which El Niños were the strongest ever? 1982-83, 1997-98, 2015-16, 1972-73 and 2023-24 ranked on NOAA's indices, the 1877 giant, and where 2026-27 could land.
 Weather
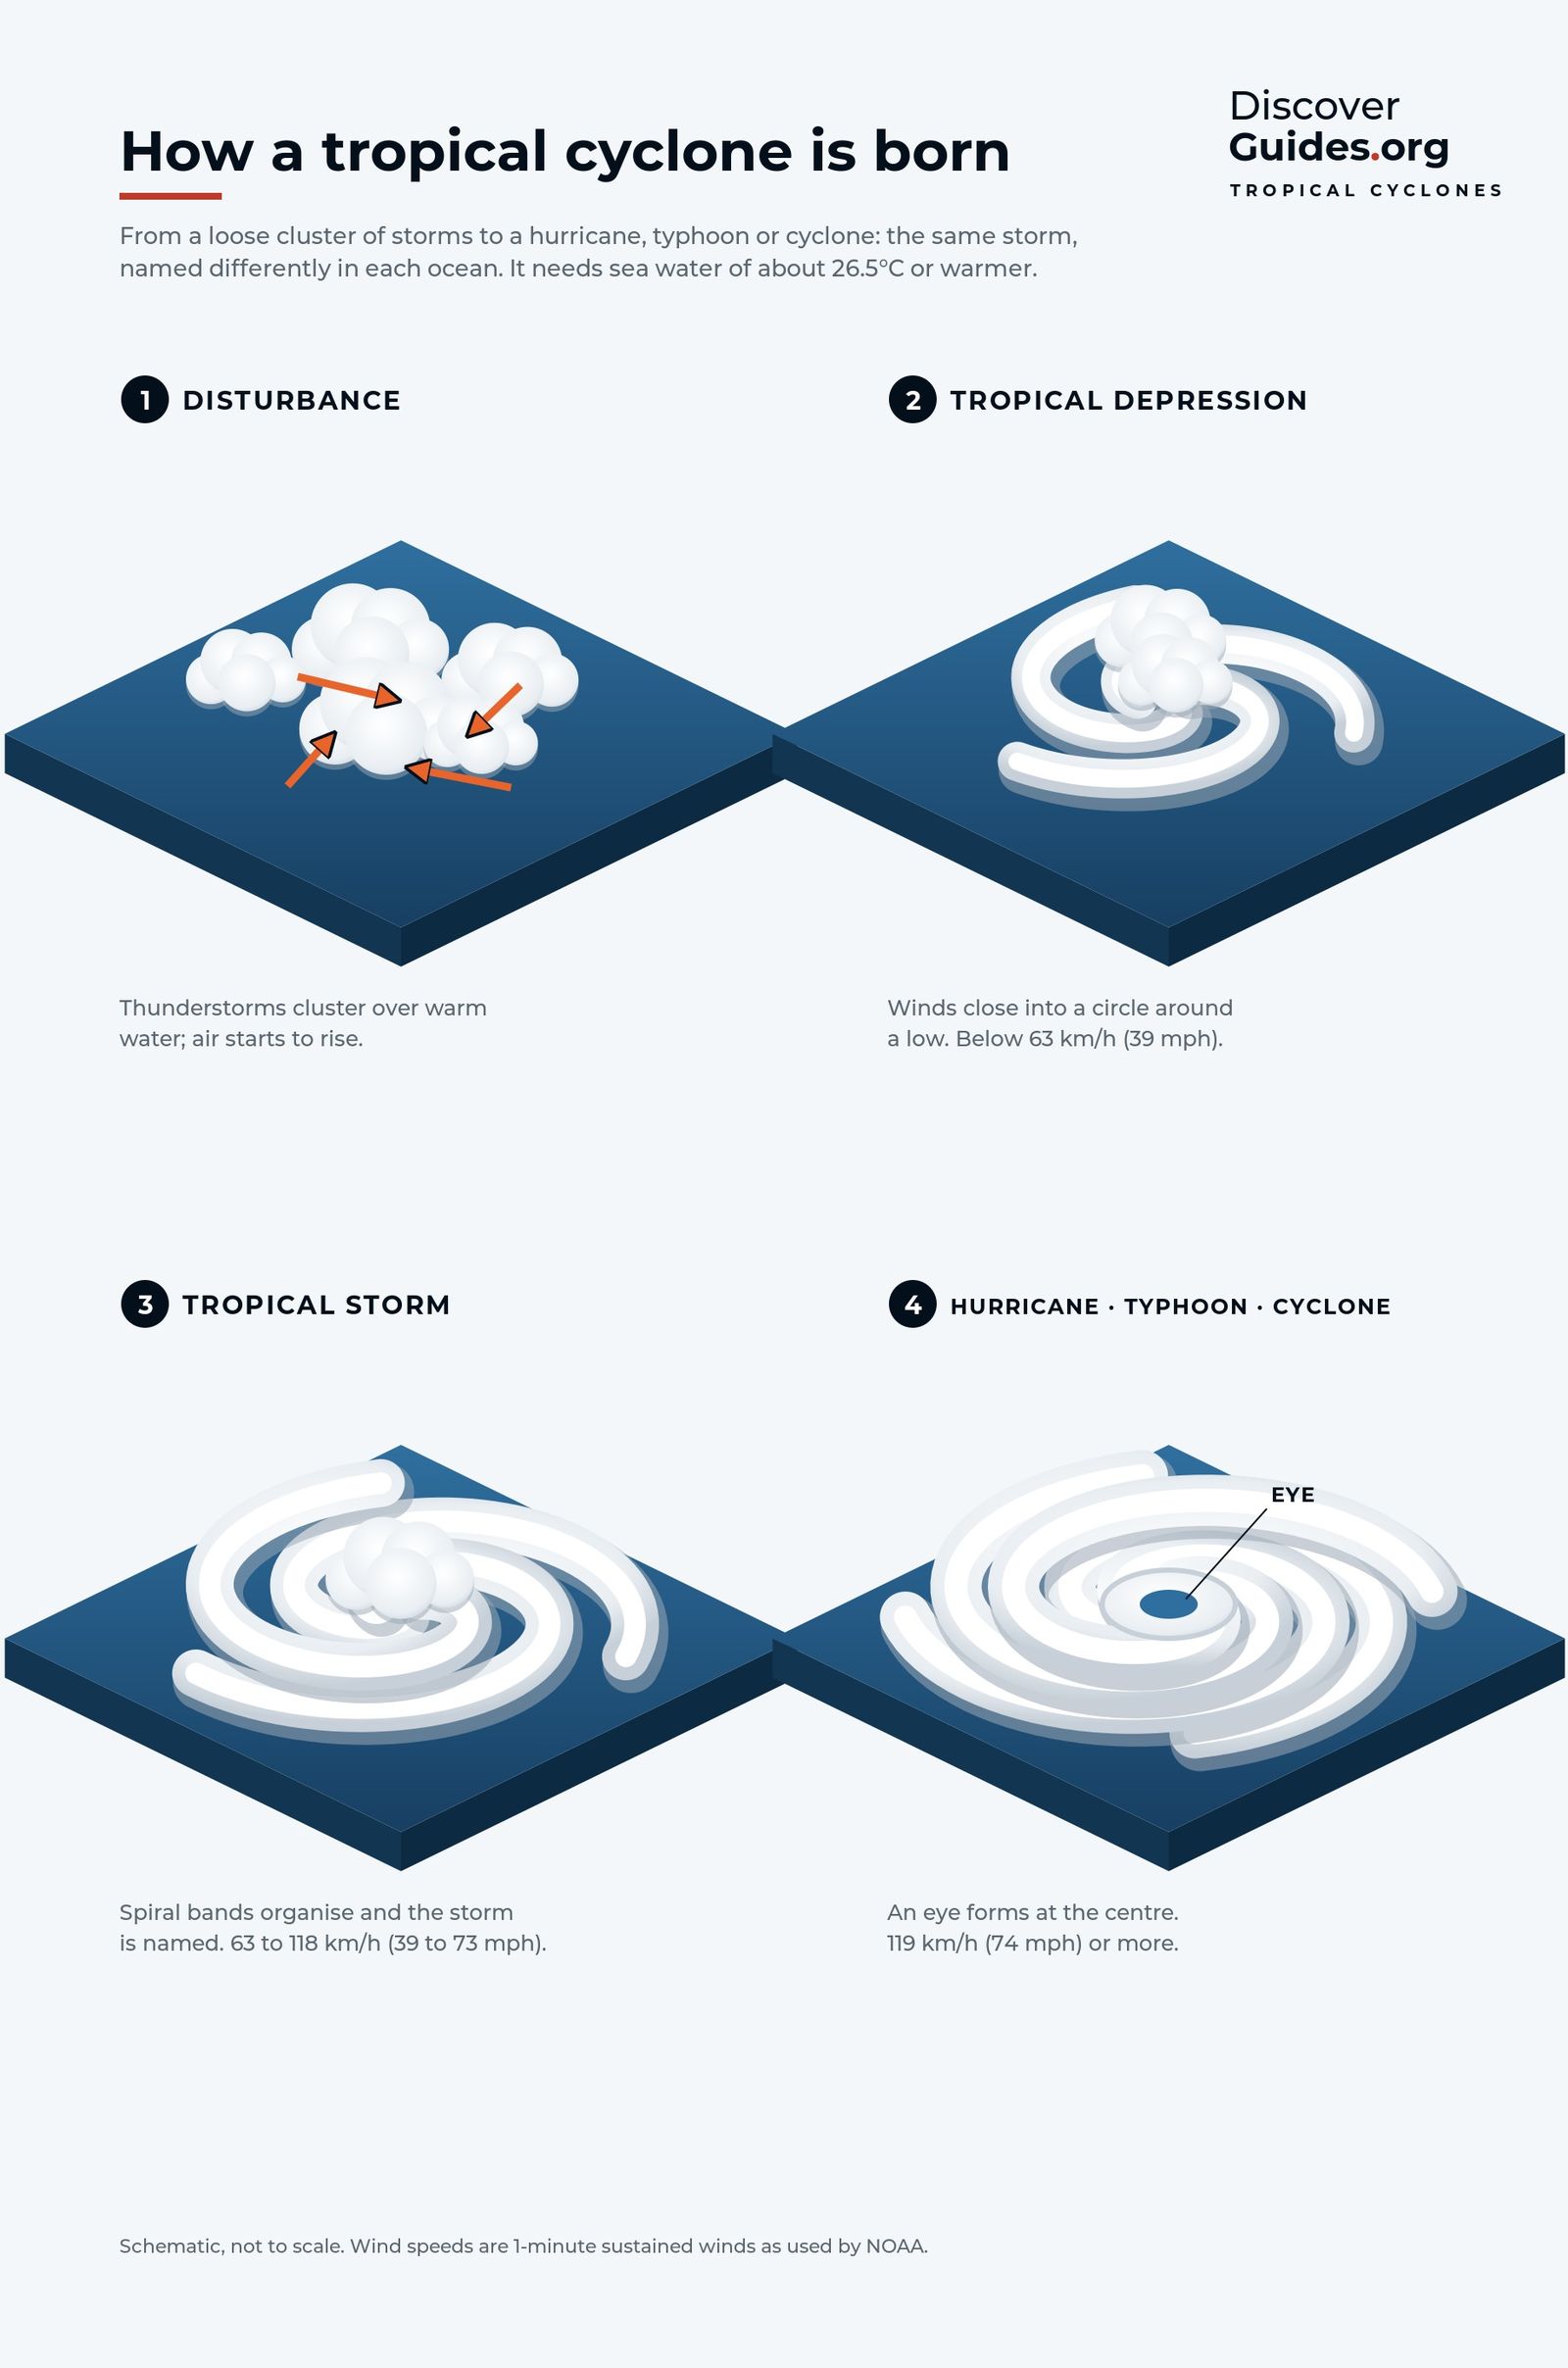
El Niño, hurricanes and typhoons
El Niño quiets the Atlantic hurricane season but stirs up the eastern and central Pacific, shifts typhoons and cuts Australia's cyclones. How it works by basin.
 Weather
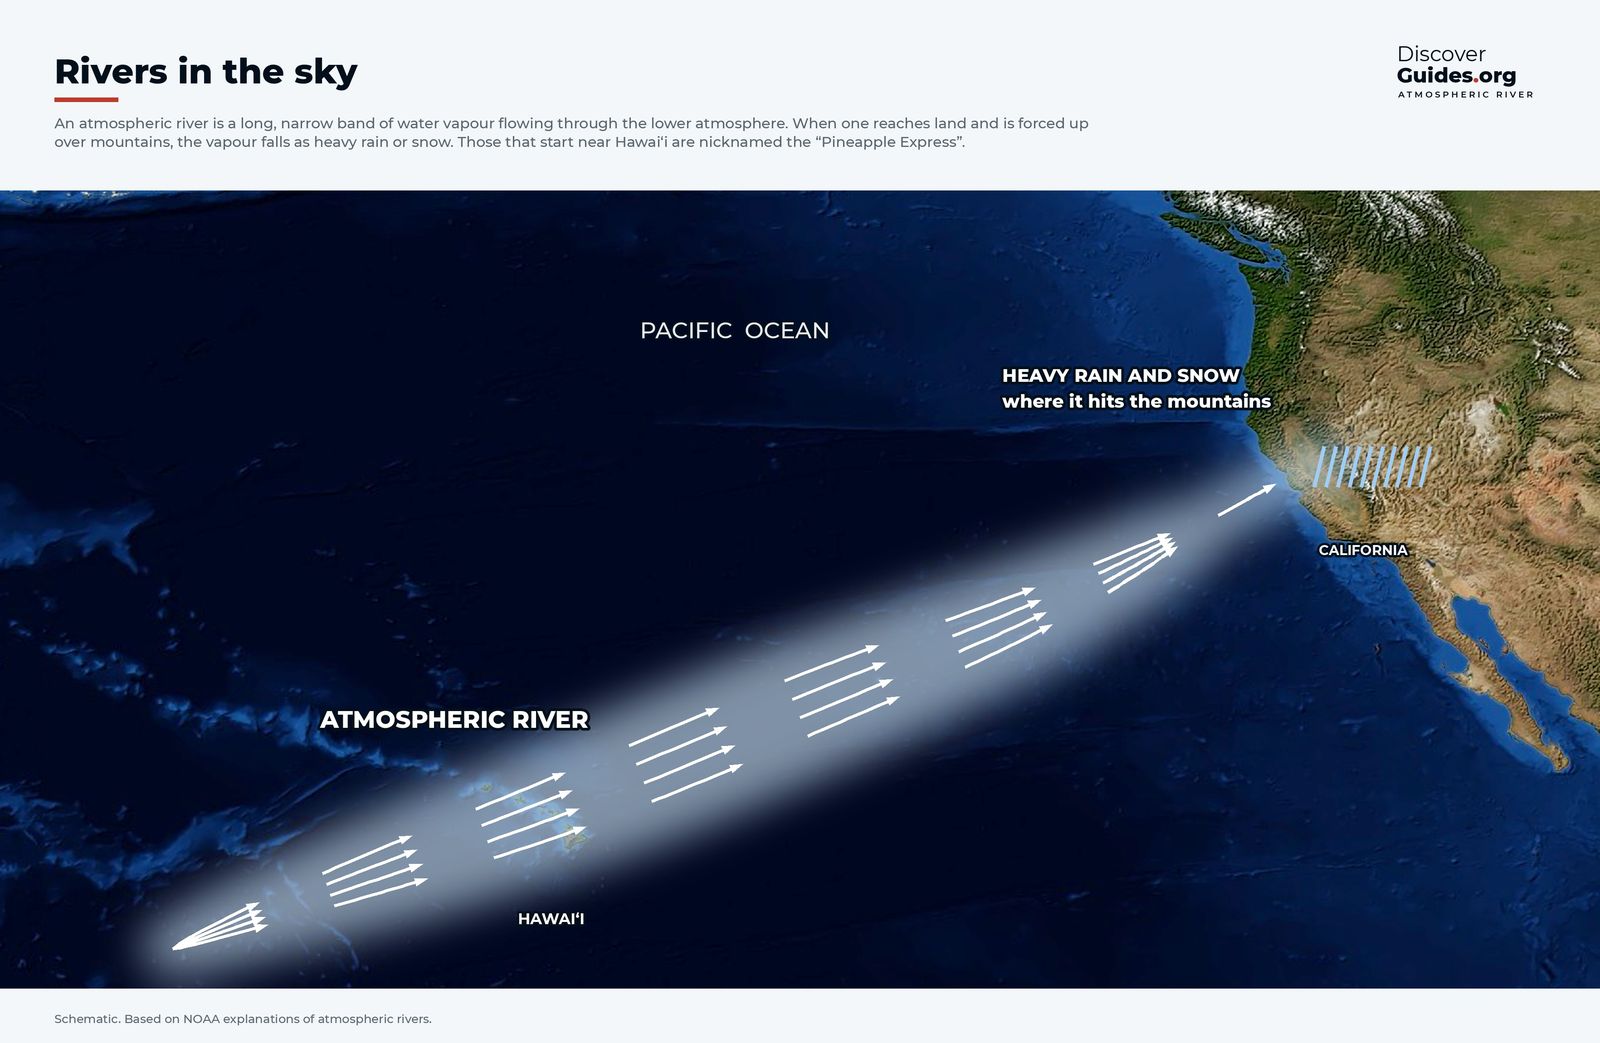
El Niño and California
Does El Niño mean a wet winter in California? How the jet stream and atmospheric rivers bring storms, what past El Niños delivered and the 2026-27 outlook.
 Weather
El Niño in Peru
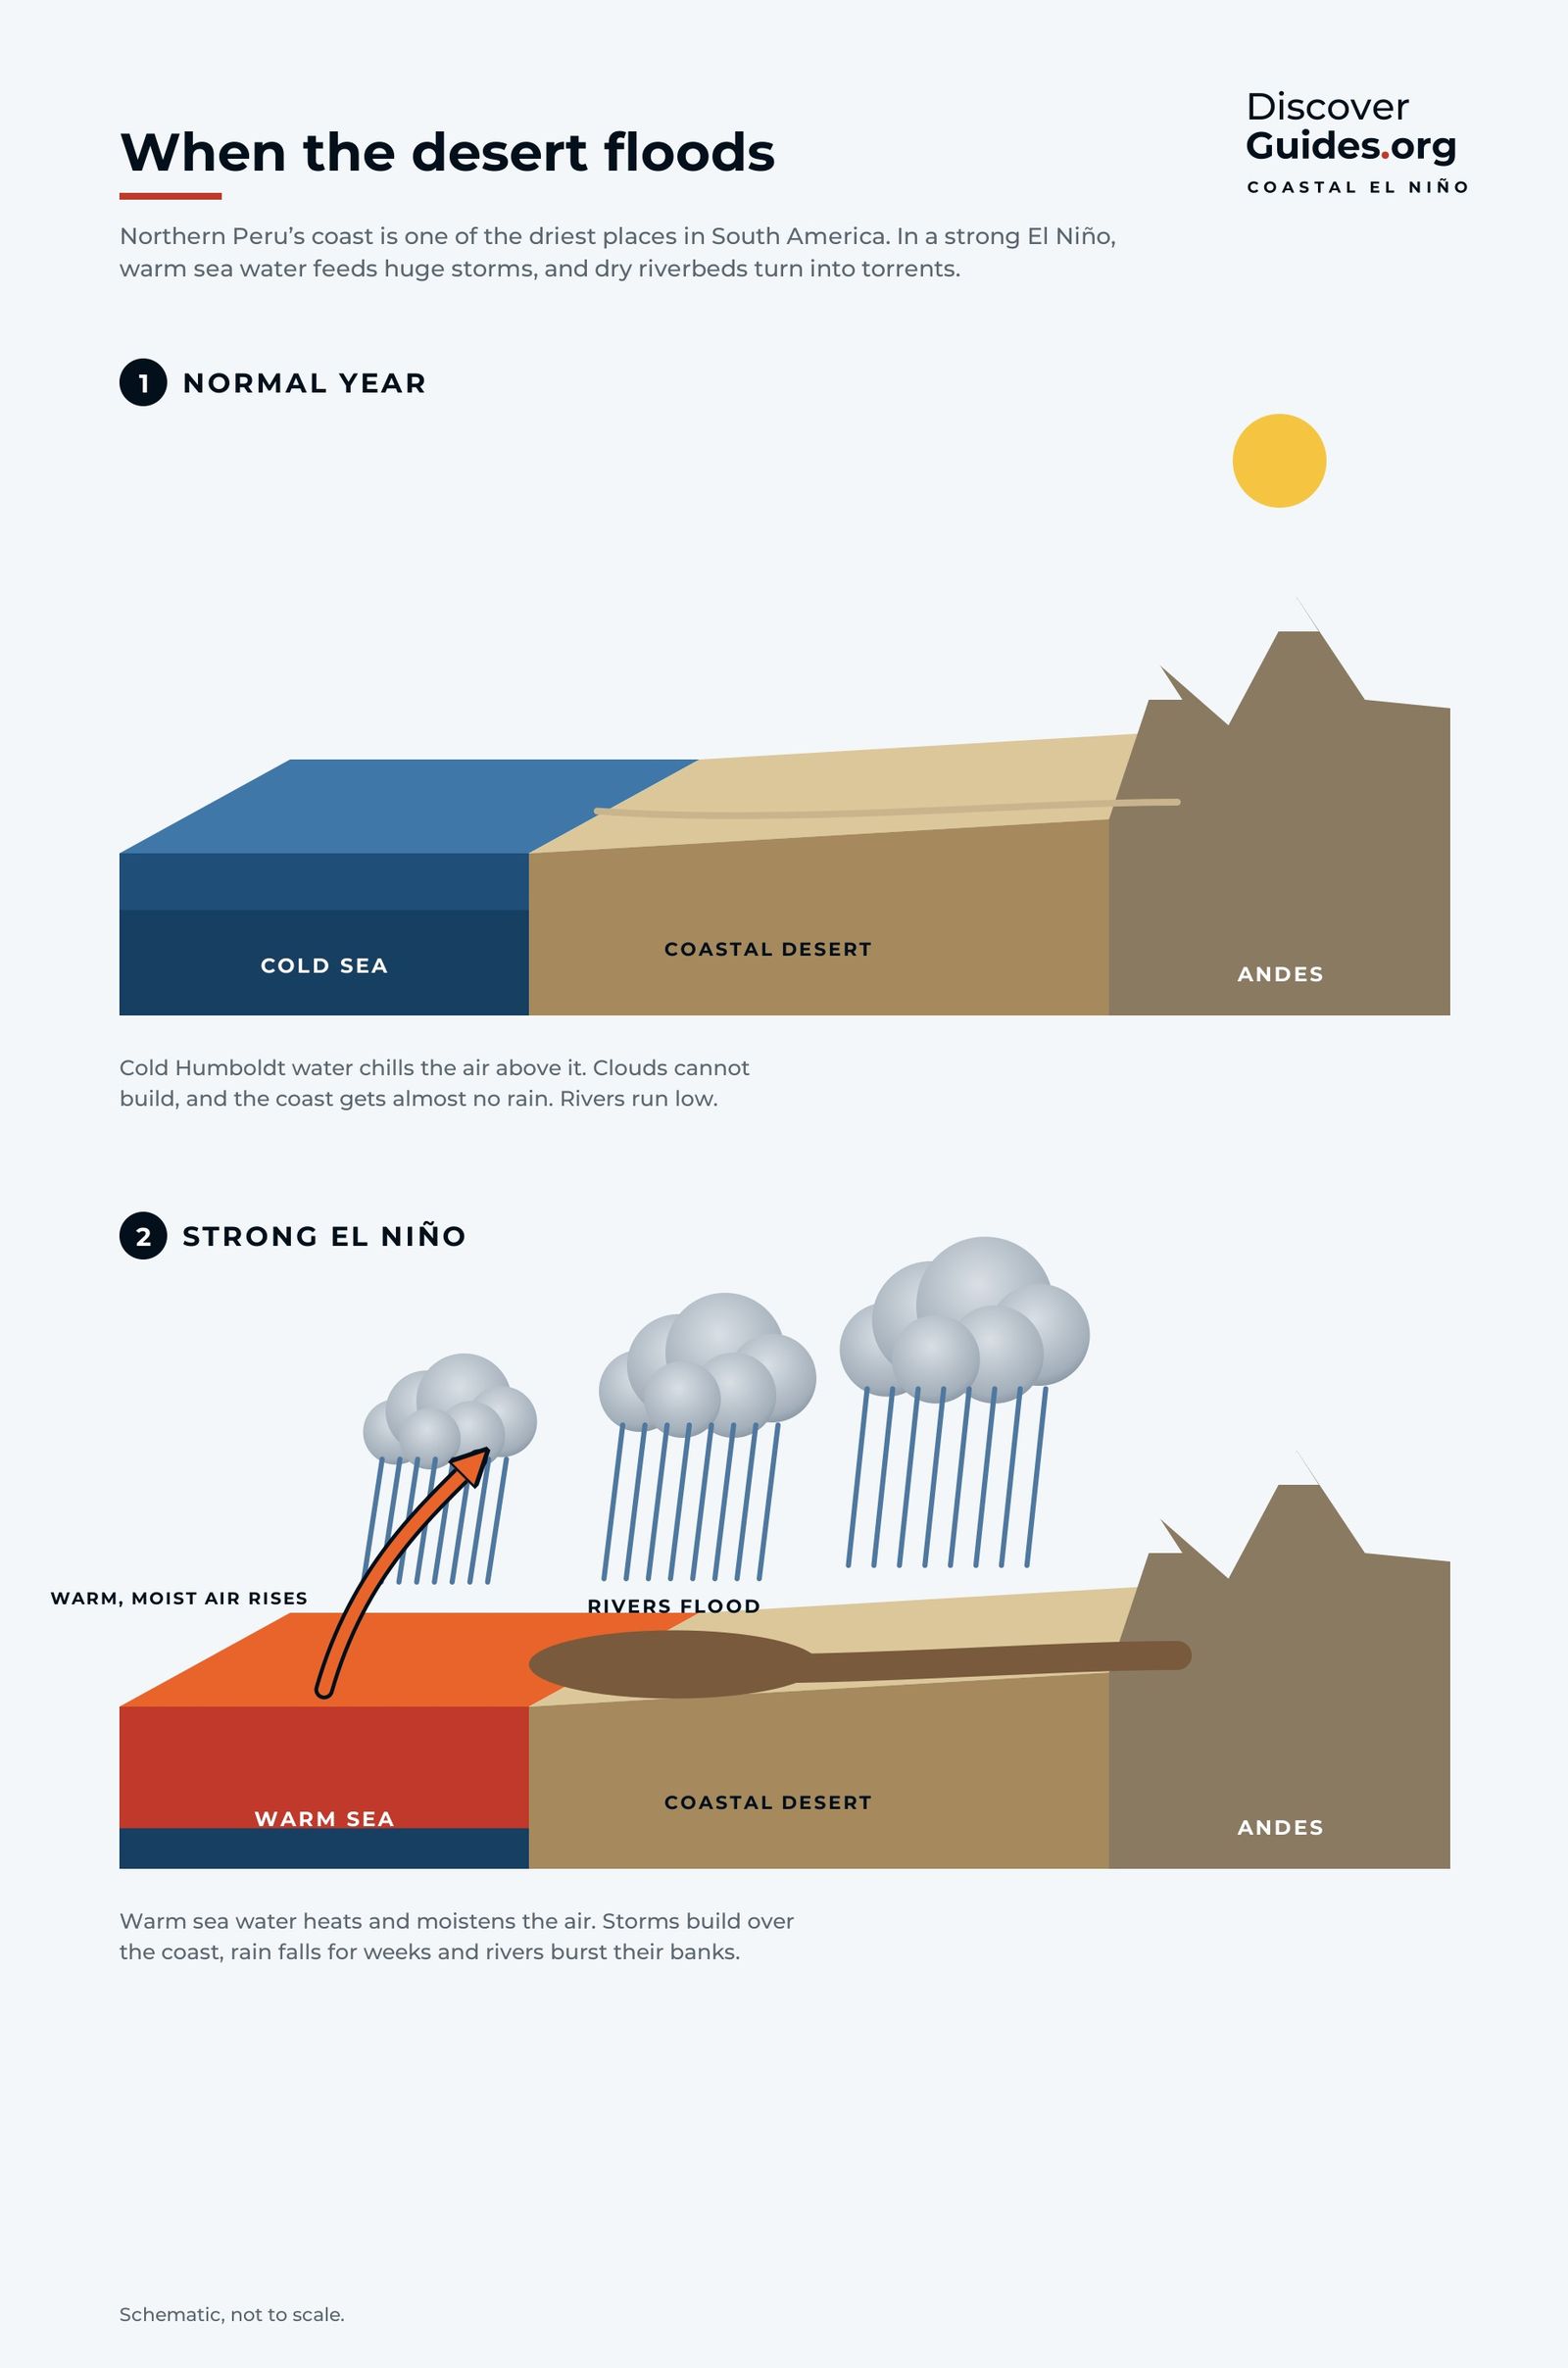
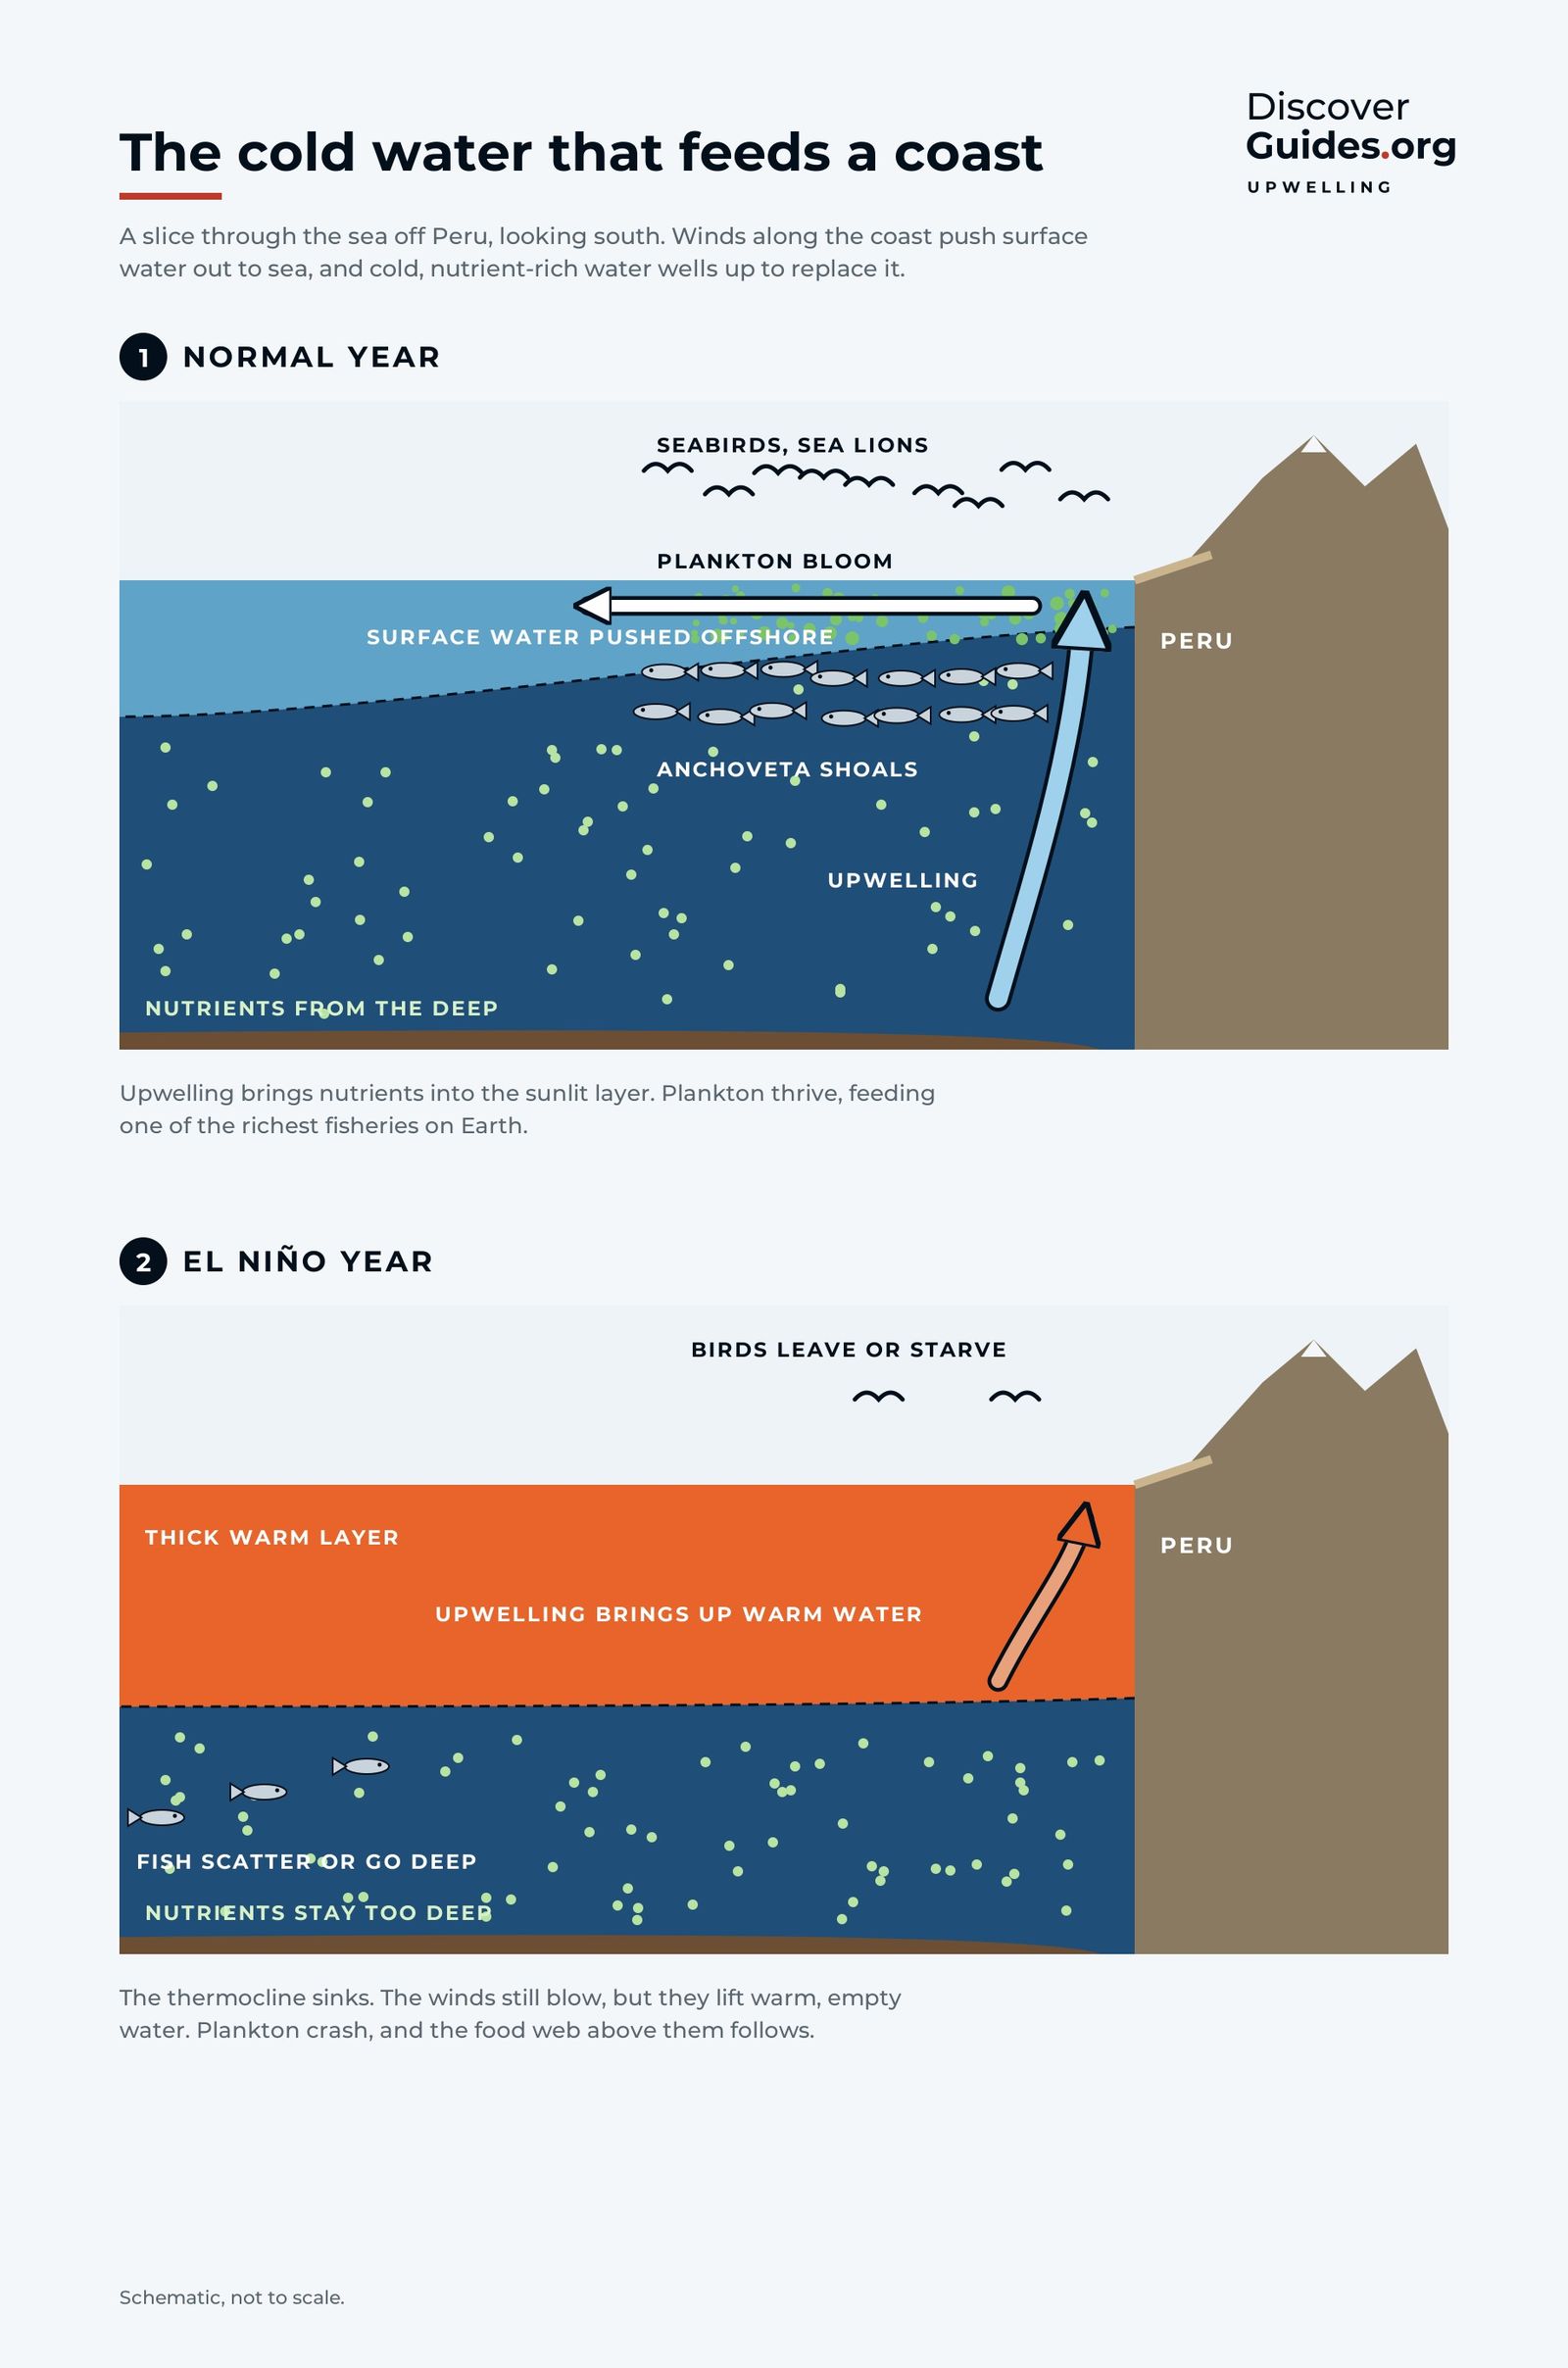
Why El Niño floods Peru's desert coast and empties its sea of anchoveta: the Humboldt upwelling, the 1972 fishery collapse, coastal El Niños and the 2026 alert.
 Life in hot water
El Niño and coral bleaching
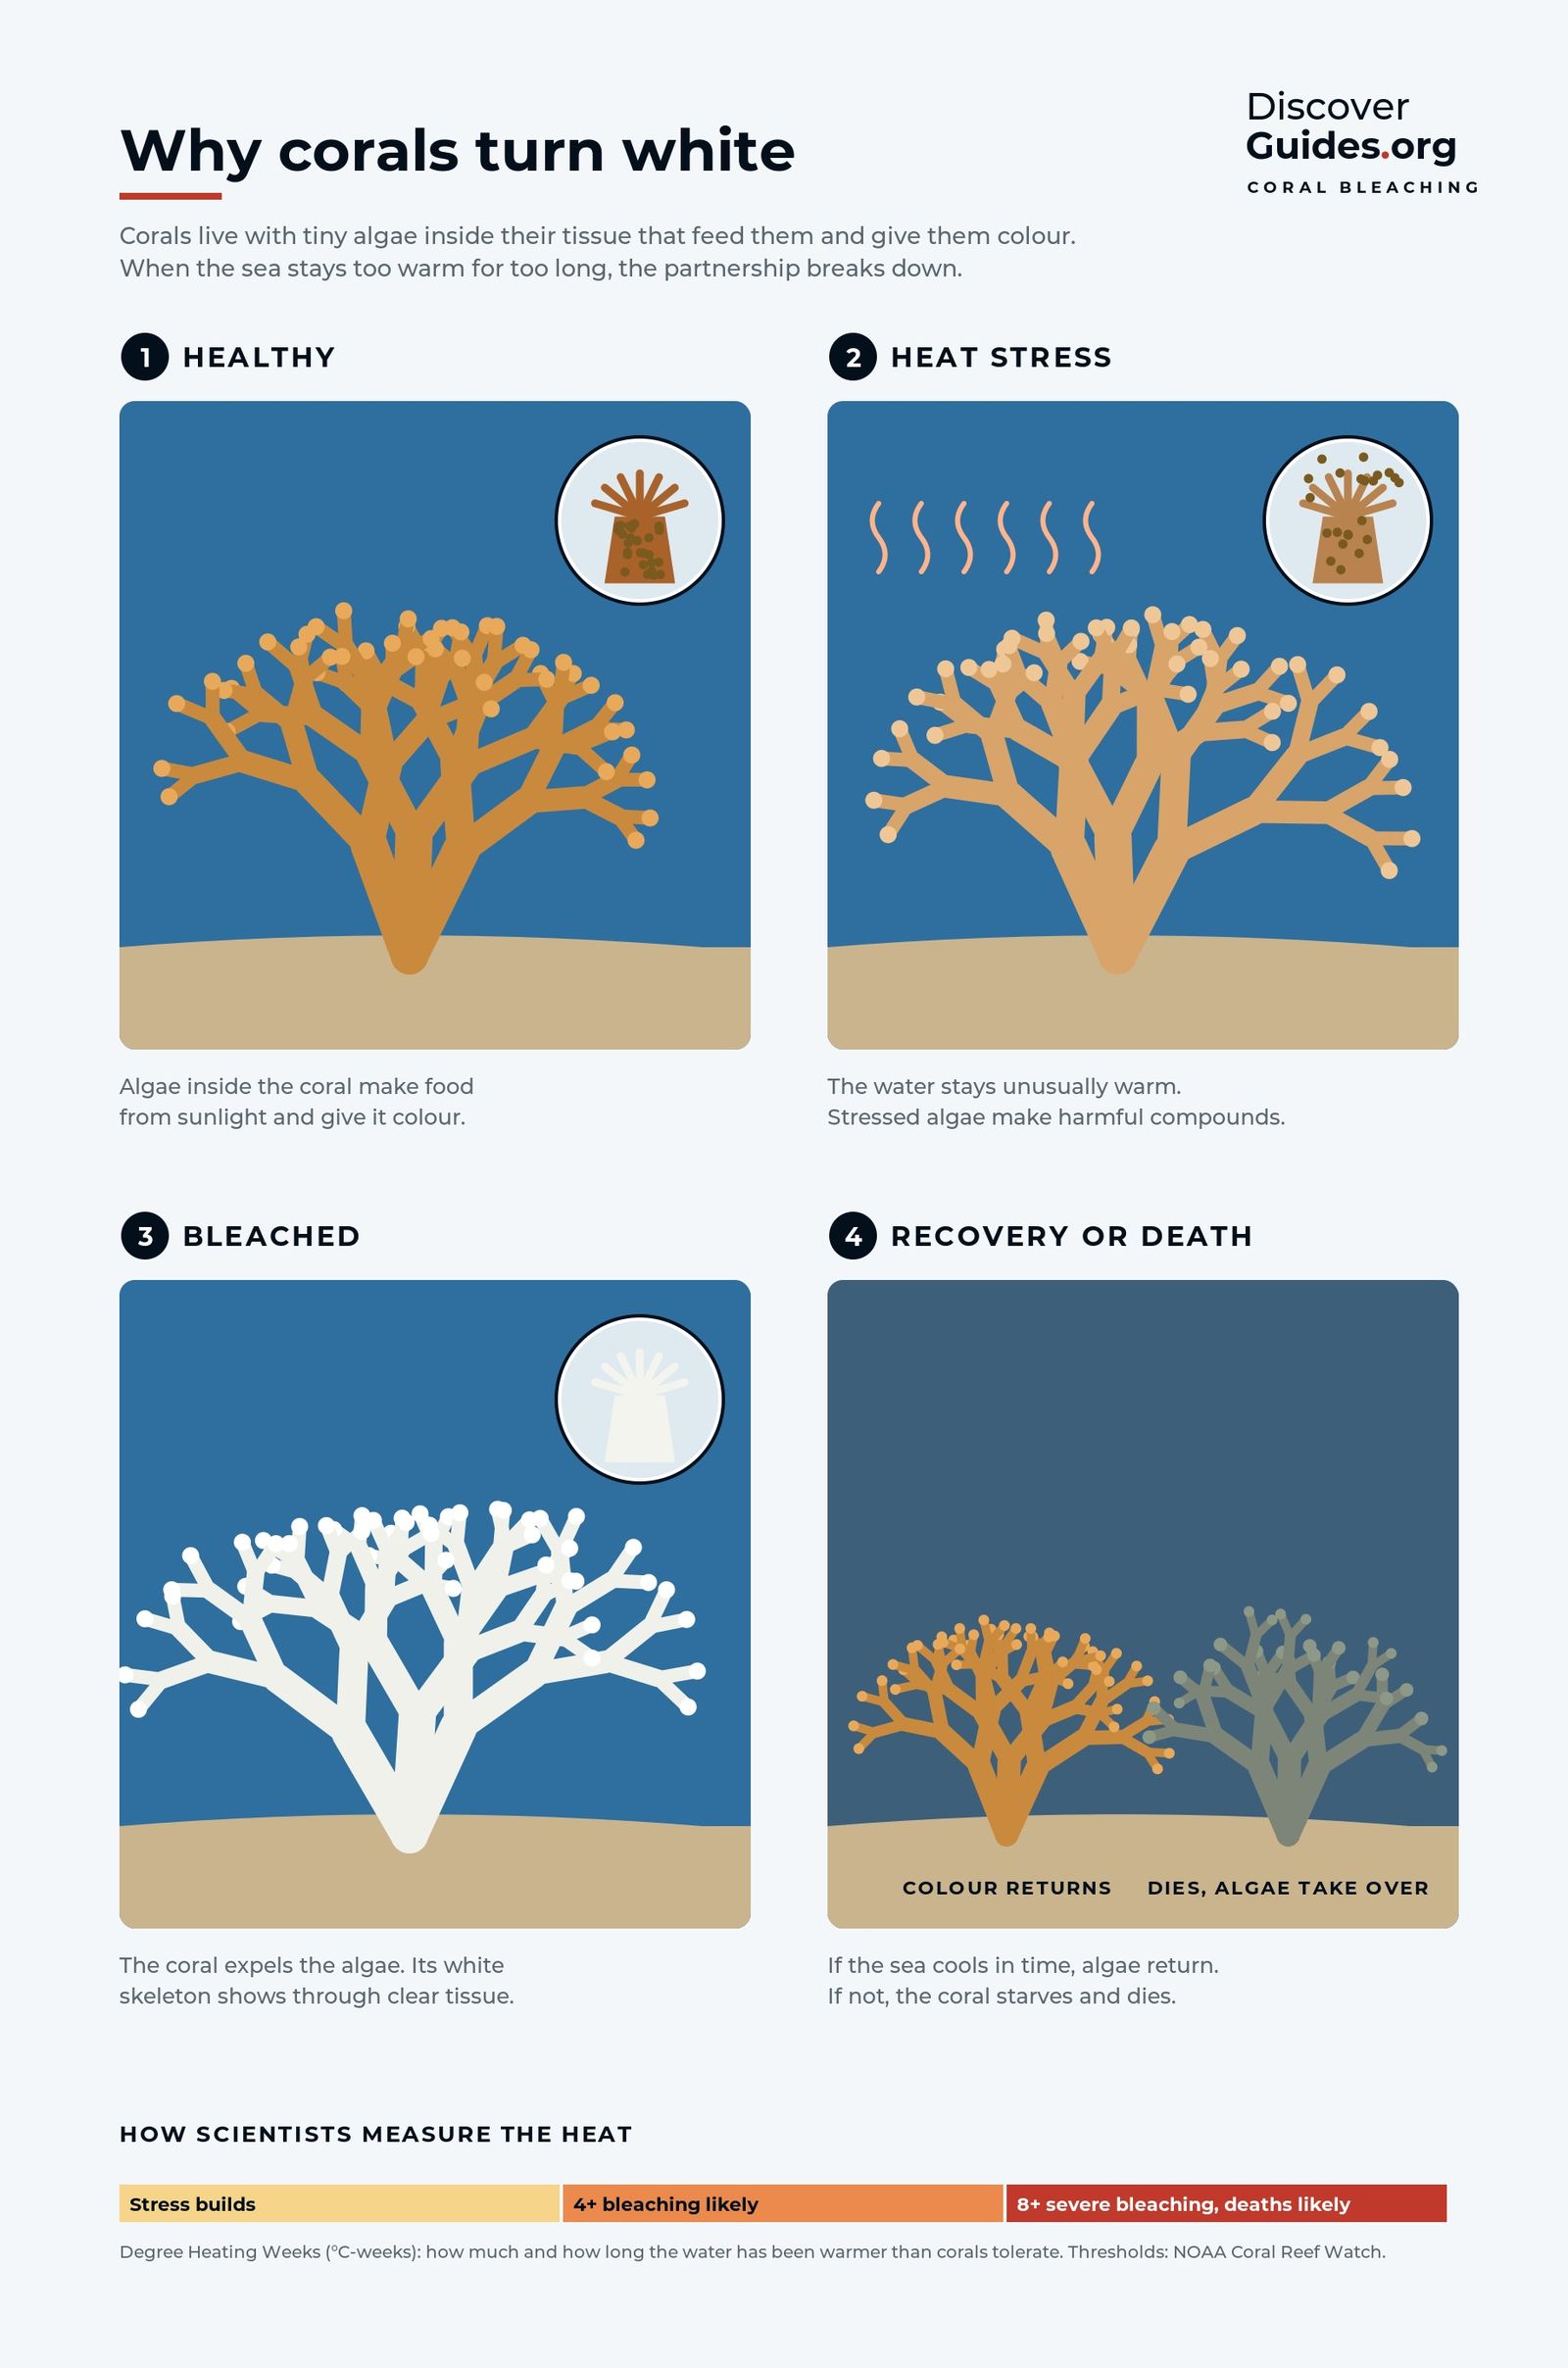
Why El Niño heat turns corals white: the algae partnership, NOAA's degree heating weeks, four global bleaching events and the risk to reefs in 2026-27.
 El Niño basics
What is a Kelvin wave?
Oceanic Kelvin waves explained: how westerly wind bursts launch a bulge of warm water that crosses the Pacific in two to three months and switches on El Niño.
 Life in hot water
What is ocean upwelling?
Upwelling explained: how wind and Earth's spin lift cold, nutrient-rich water off Peru, why it feeds the world's biggest fishery, and how El Niño switches it off.
 El Niño basics
What is the thermocline?
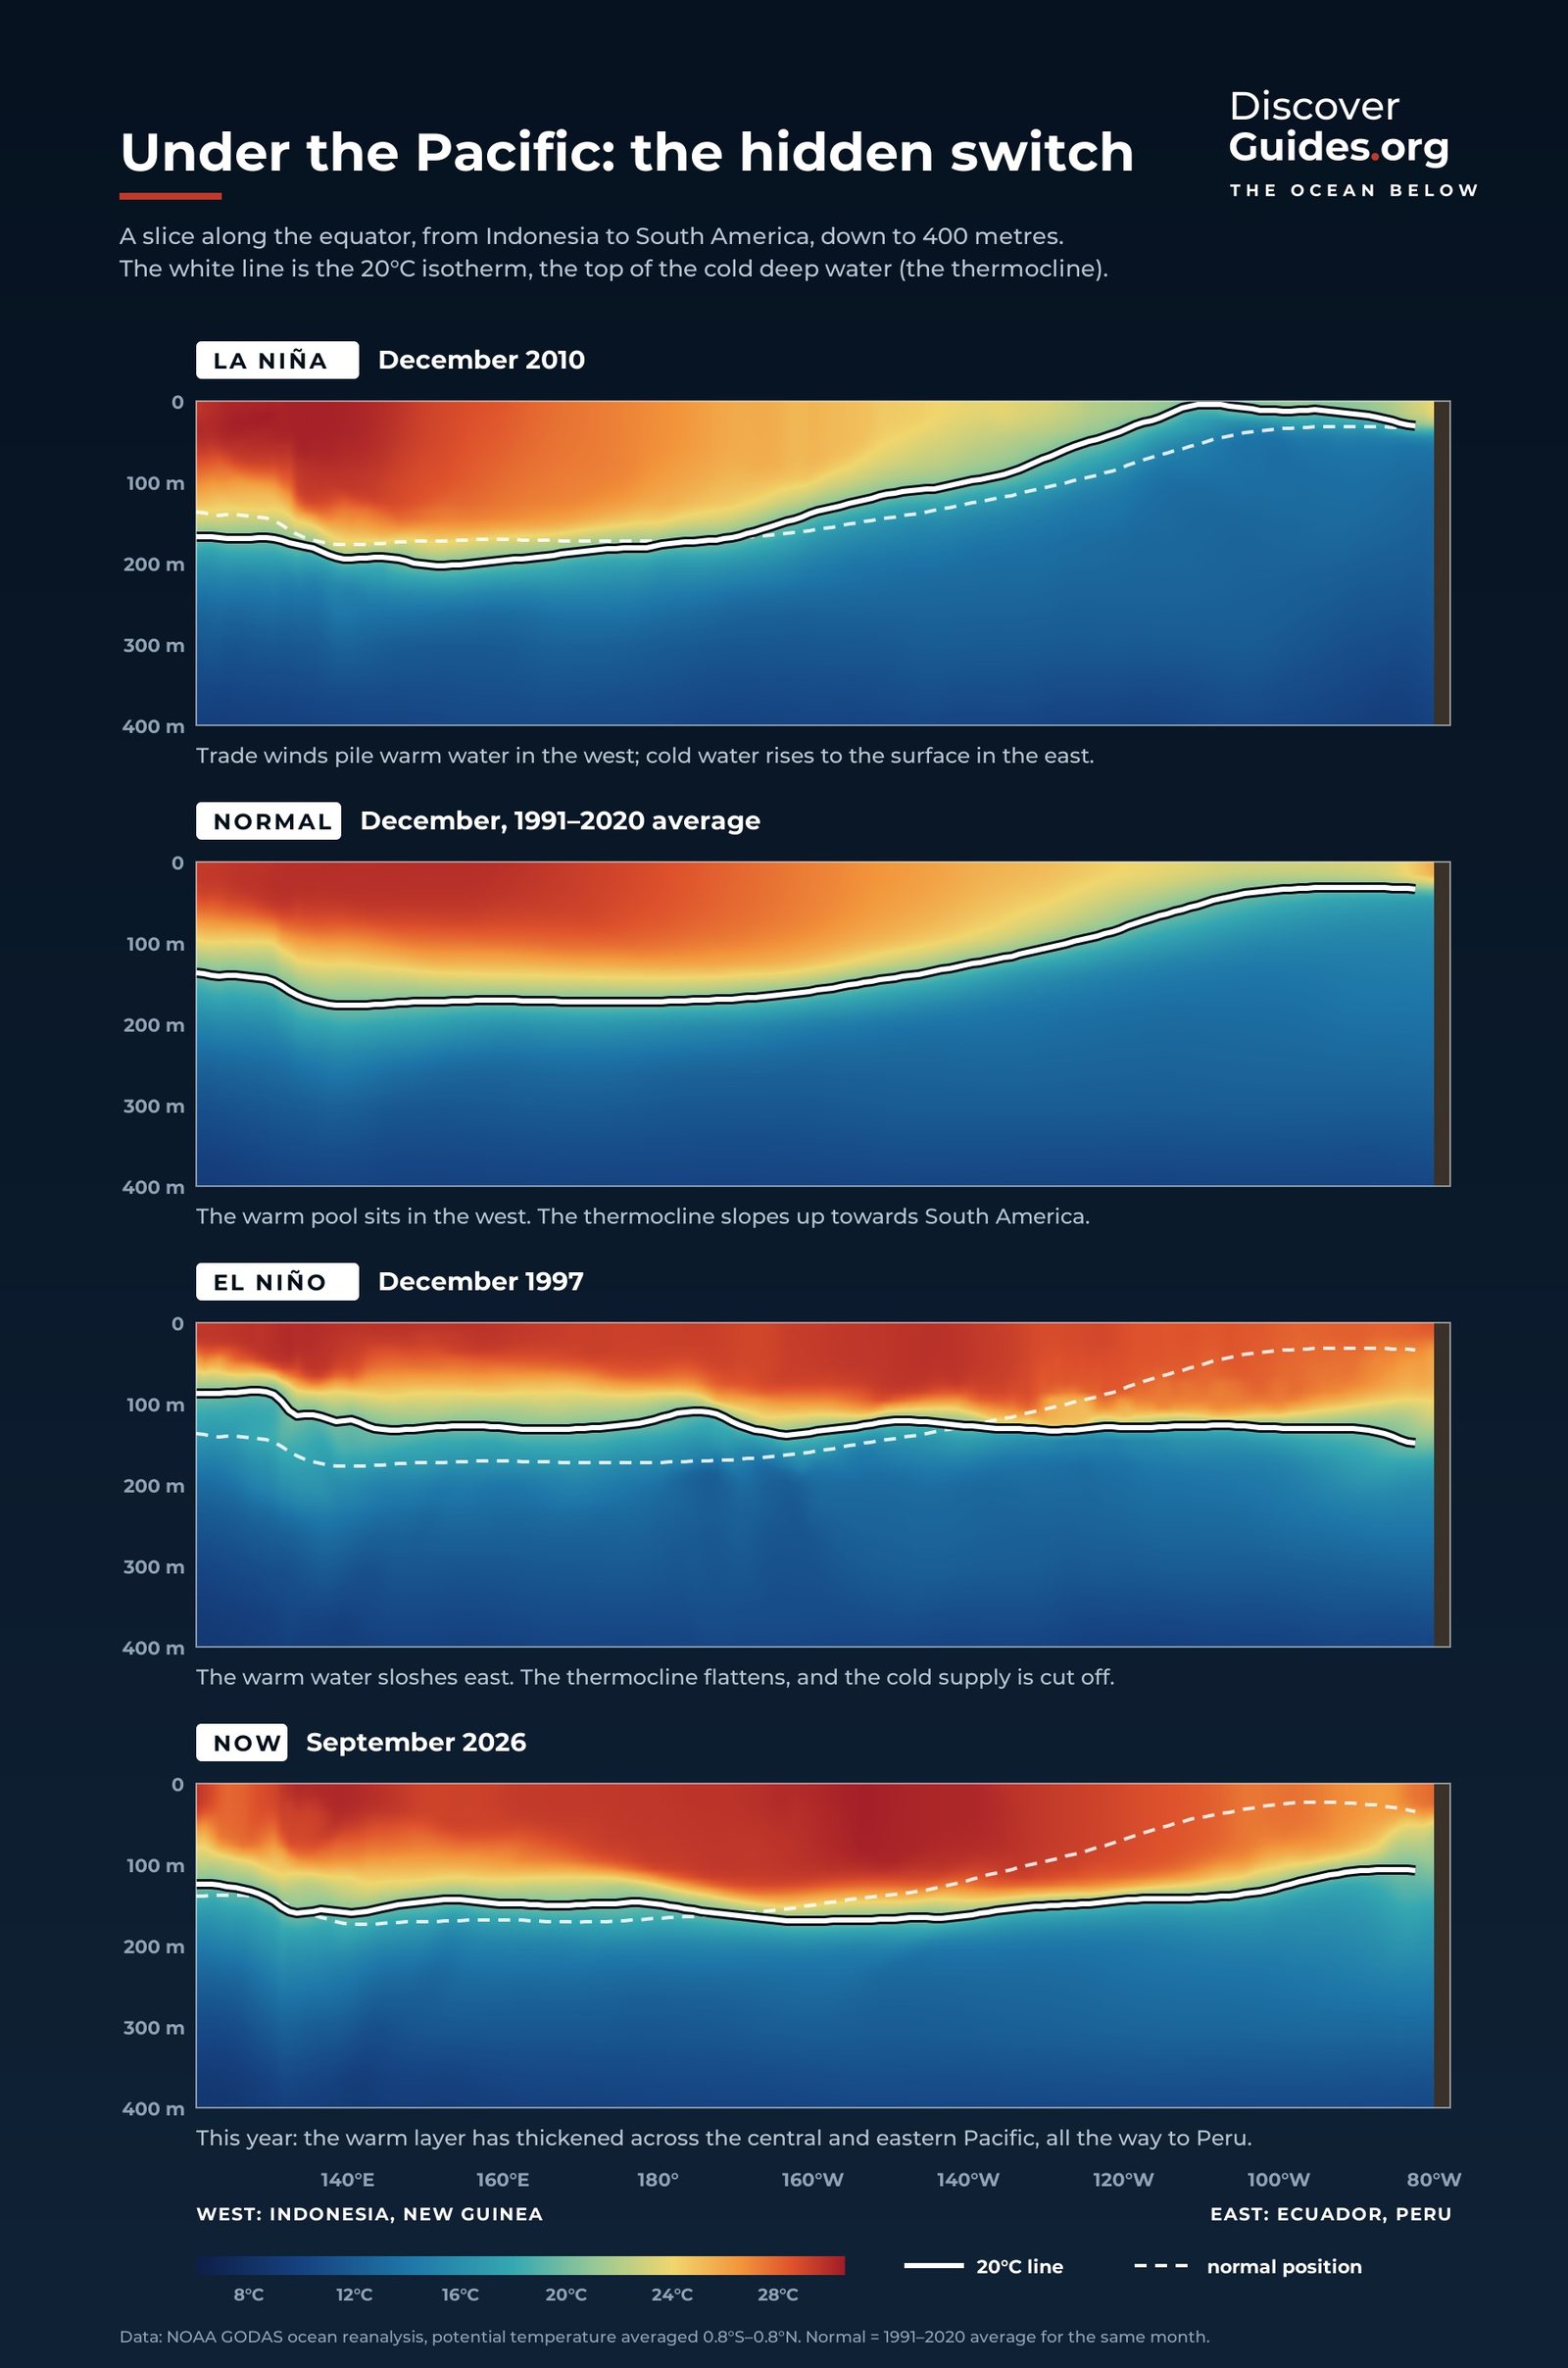
The thermocline explained: the boundary between warm and cold ocean water, why it tilts across the Pacific from 150 m to 50 m, and how flattening it creates El Niño.
 El Niño basics
What is the Walker circulation?
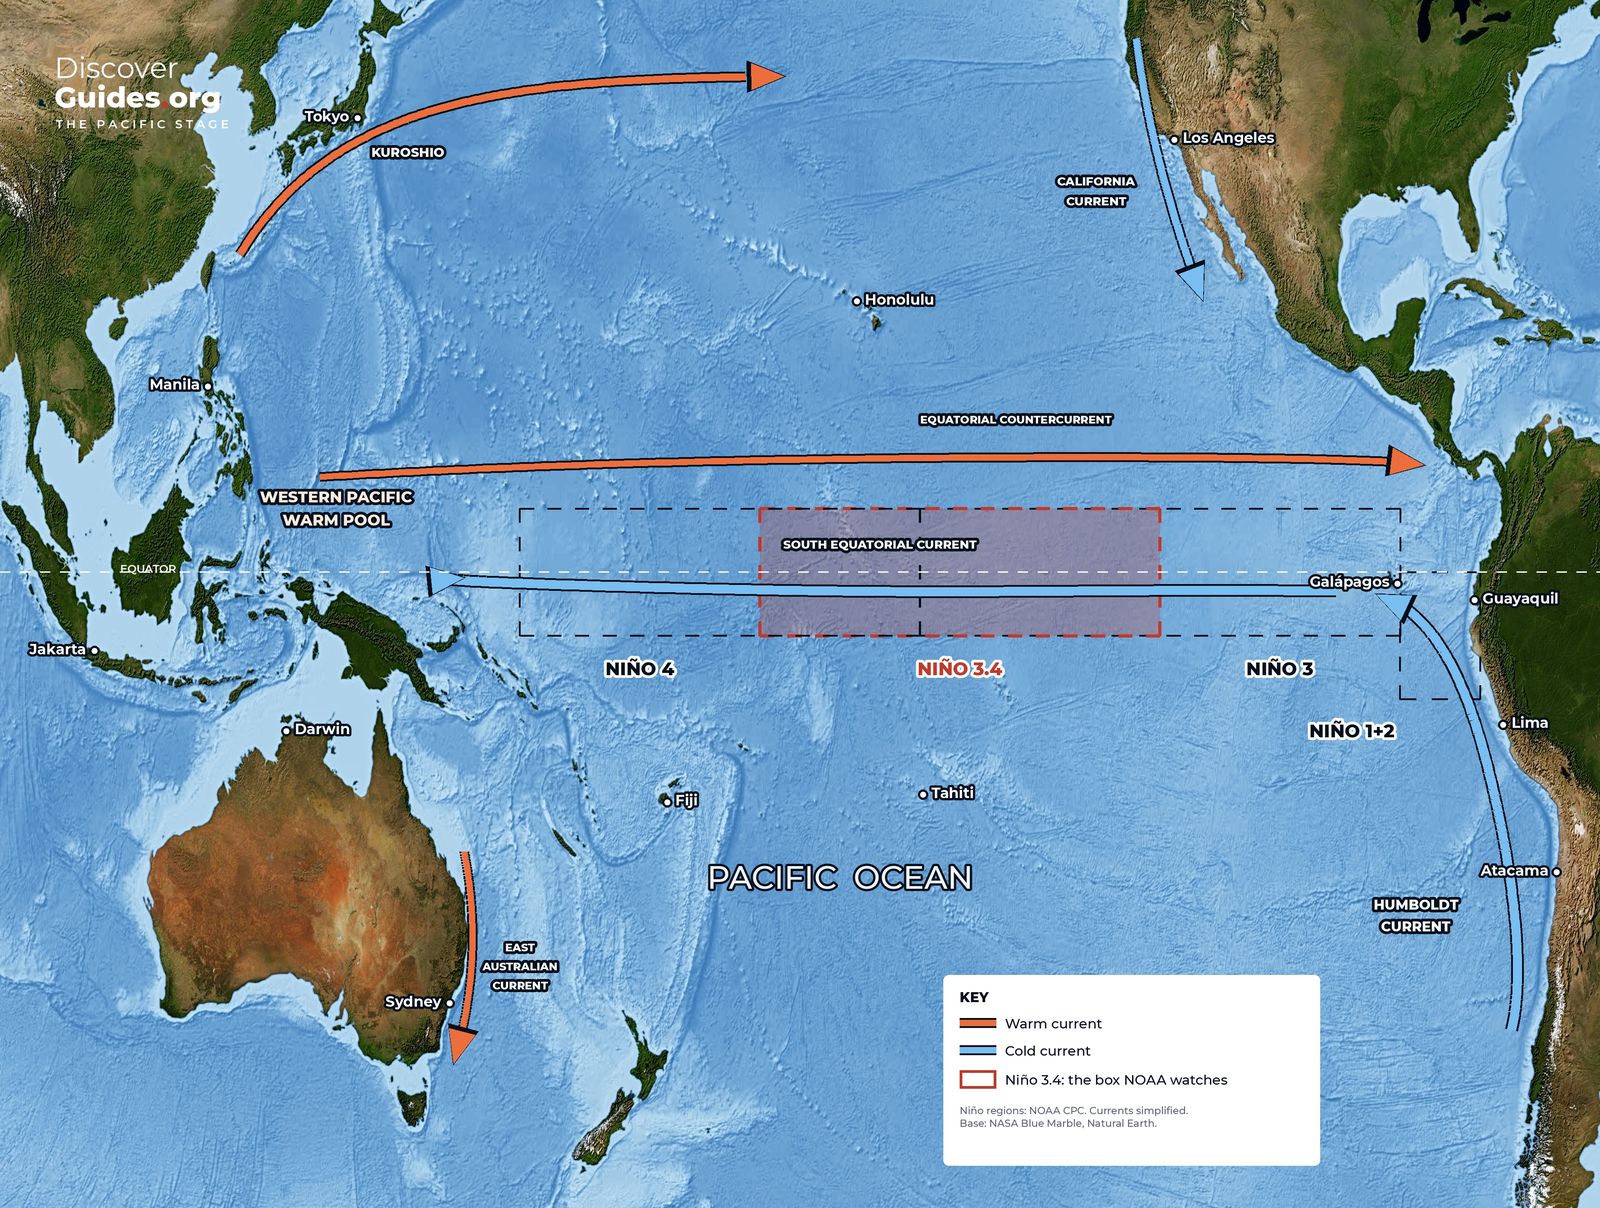
The Walker circulation explained: the loop of rising and sinking air along the equatorial Pacific, how it holds the warm pool in place, and how El Niño breaks it.
 El Niño basics
The Bjerknes feedback
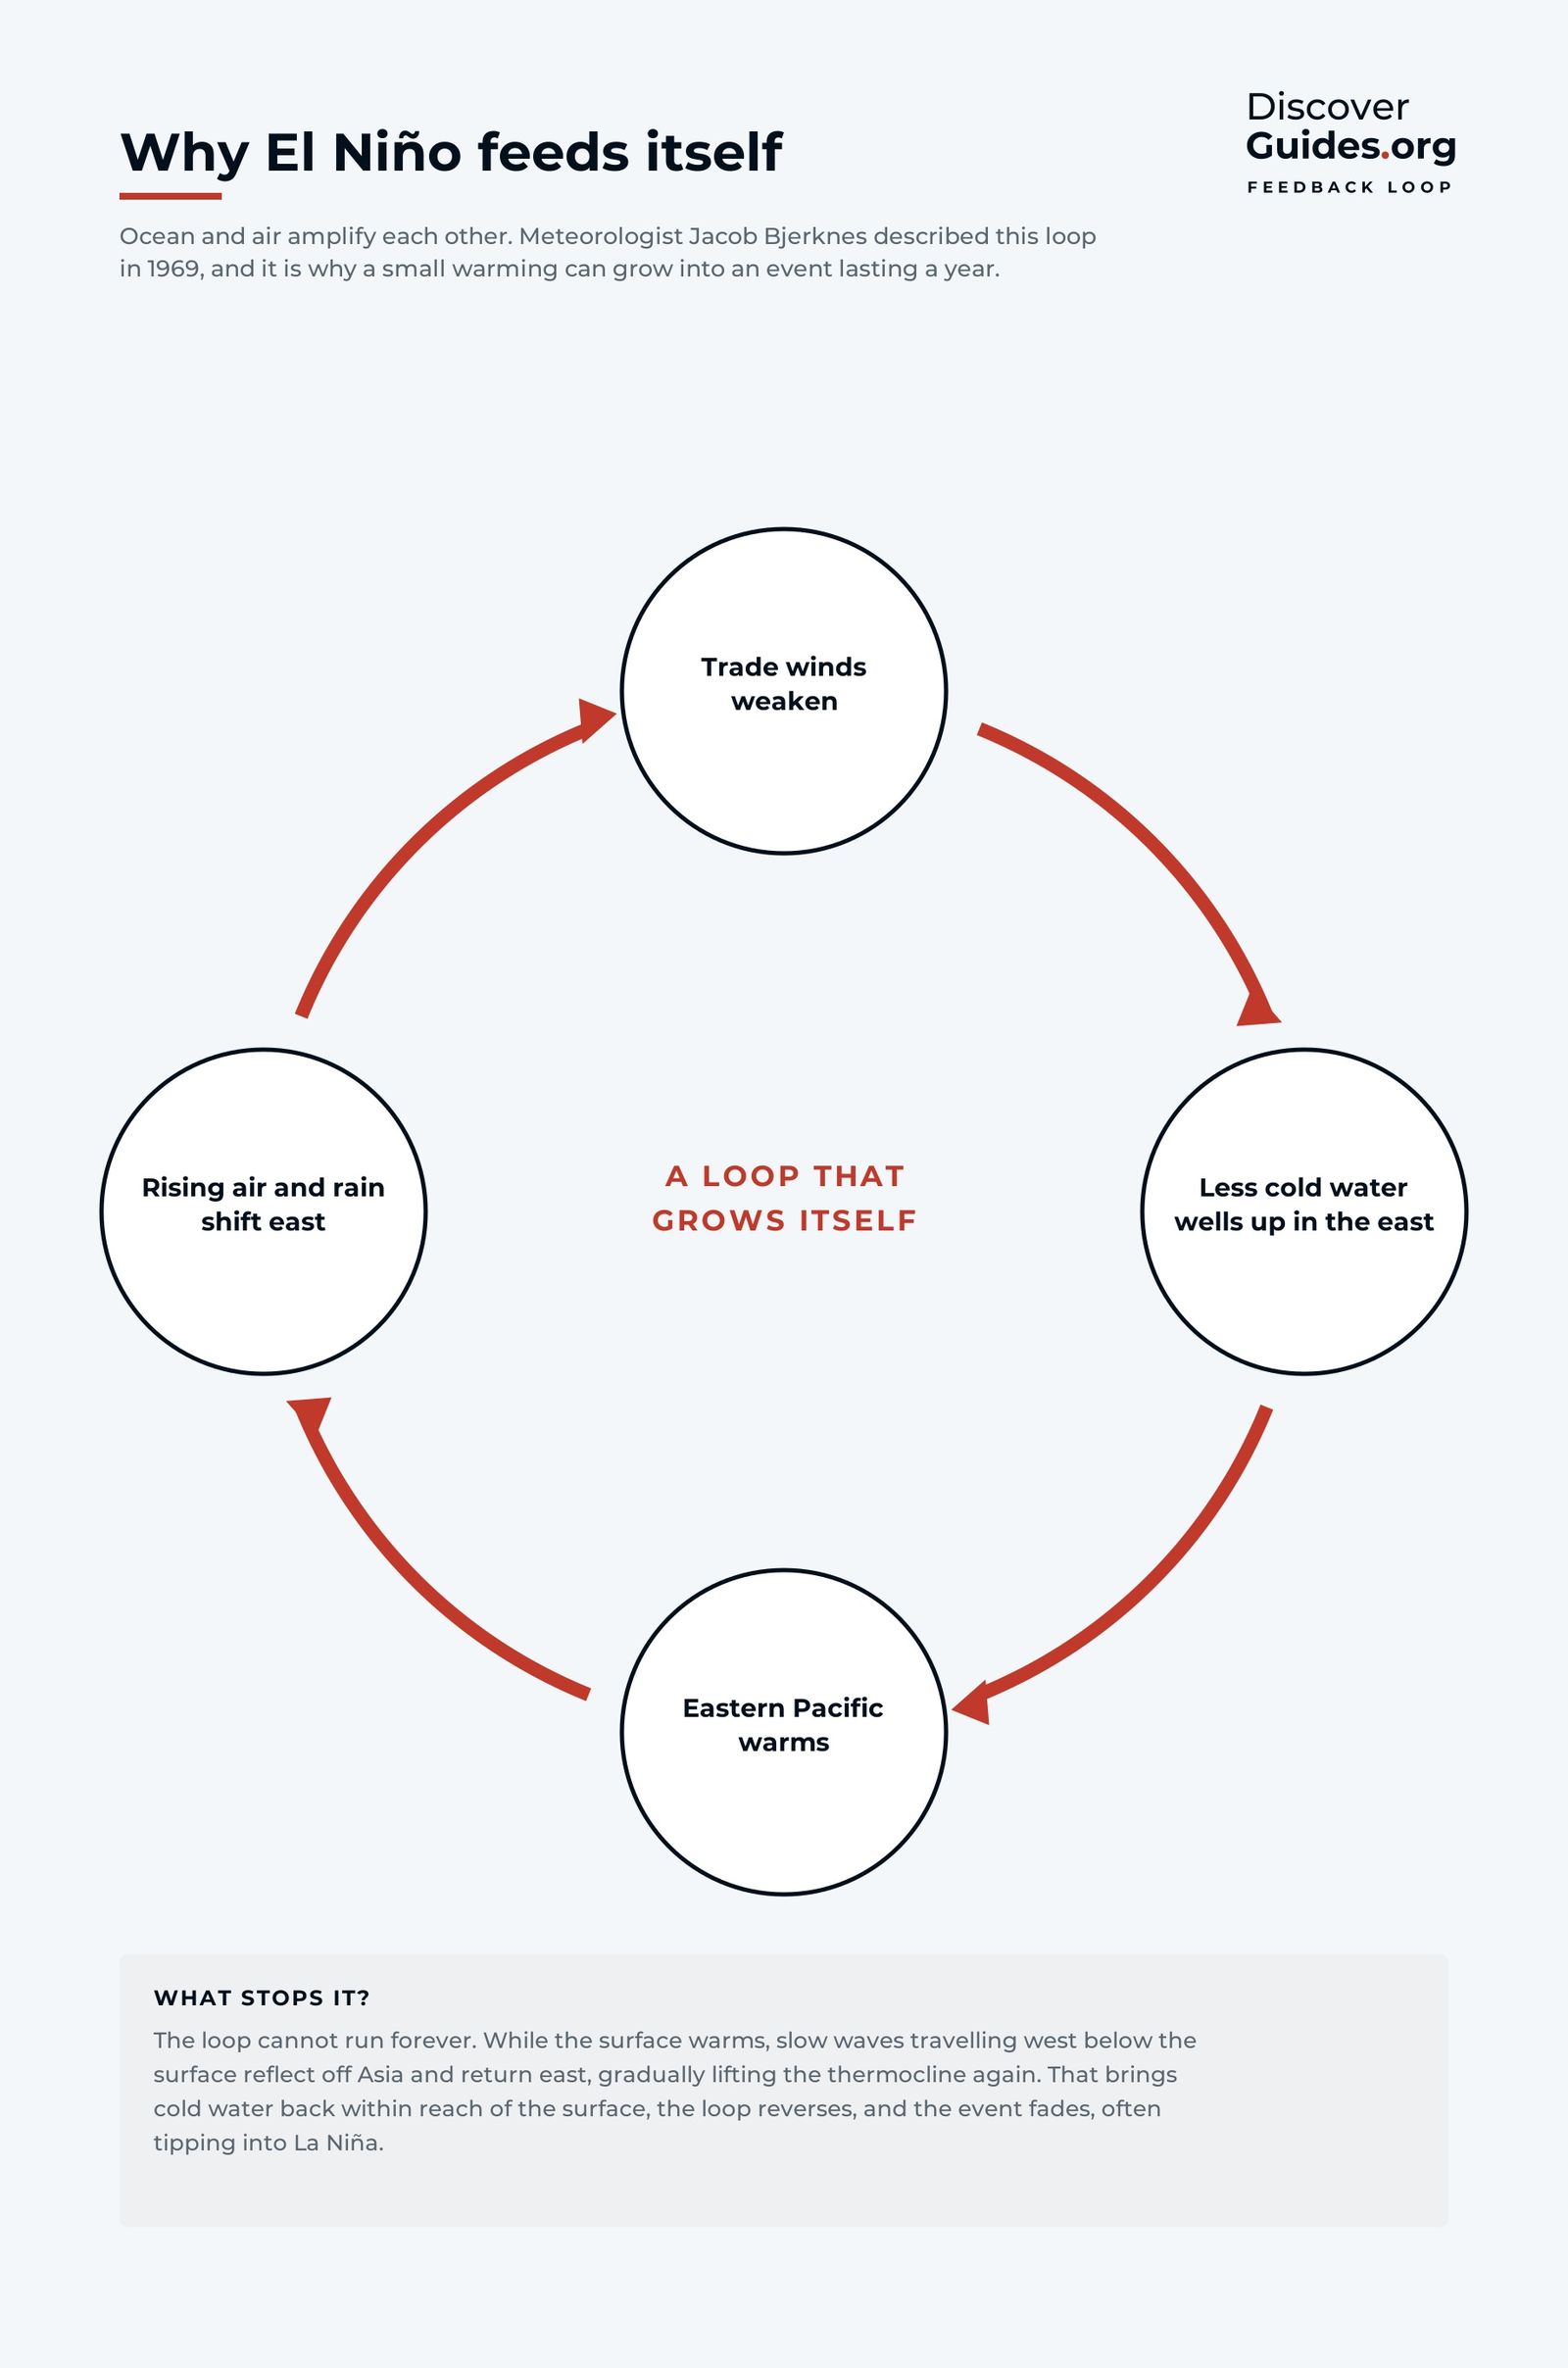
The Bjerknes feedback explained: the ocean-atmosphere chain reaction that turns weaker trade winds into a full El Niño, and why events peak around Christmas.
 El Niño basics
How long does El Niño last?
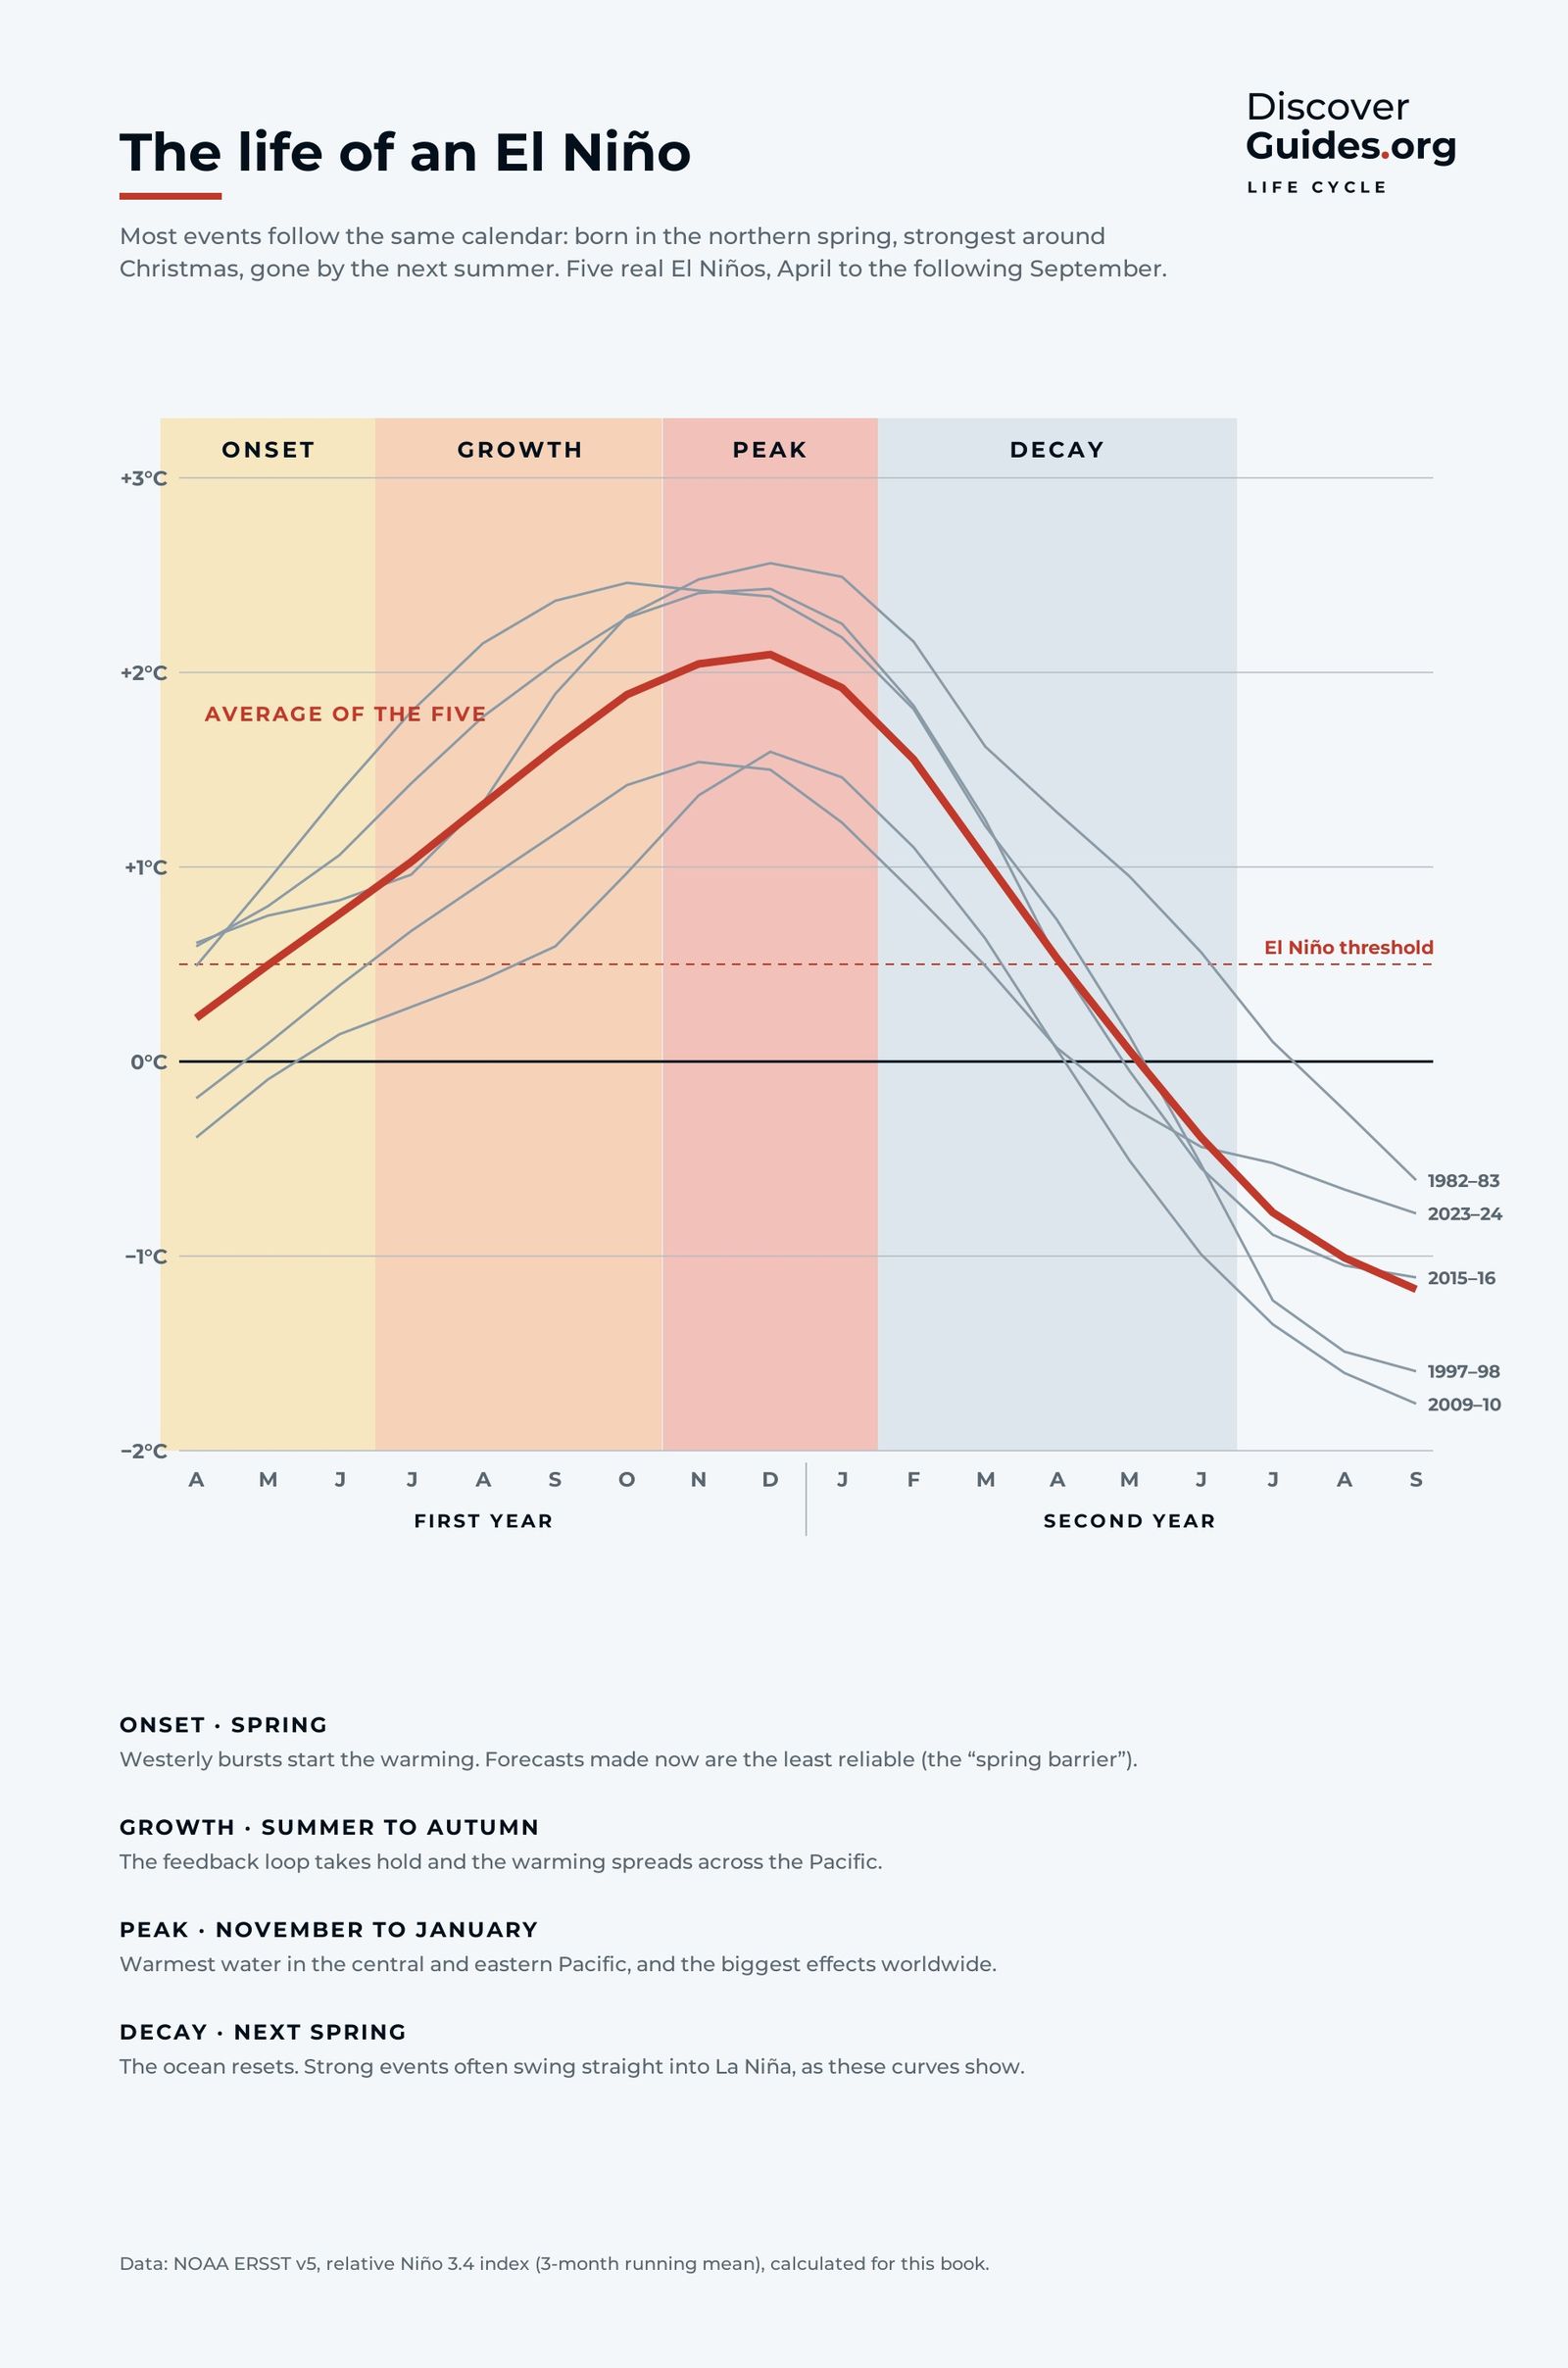
How long El Niño lasts and why: recharge, trigger, growth, peak and collapse, with the 1997-98 event month by month and what usually comes next.
 El Niño basics
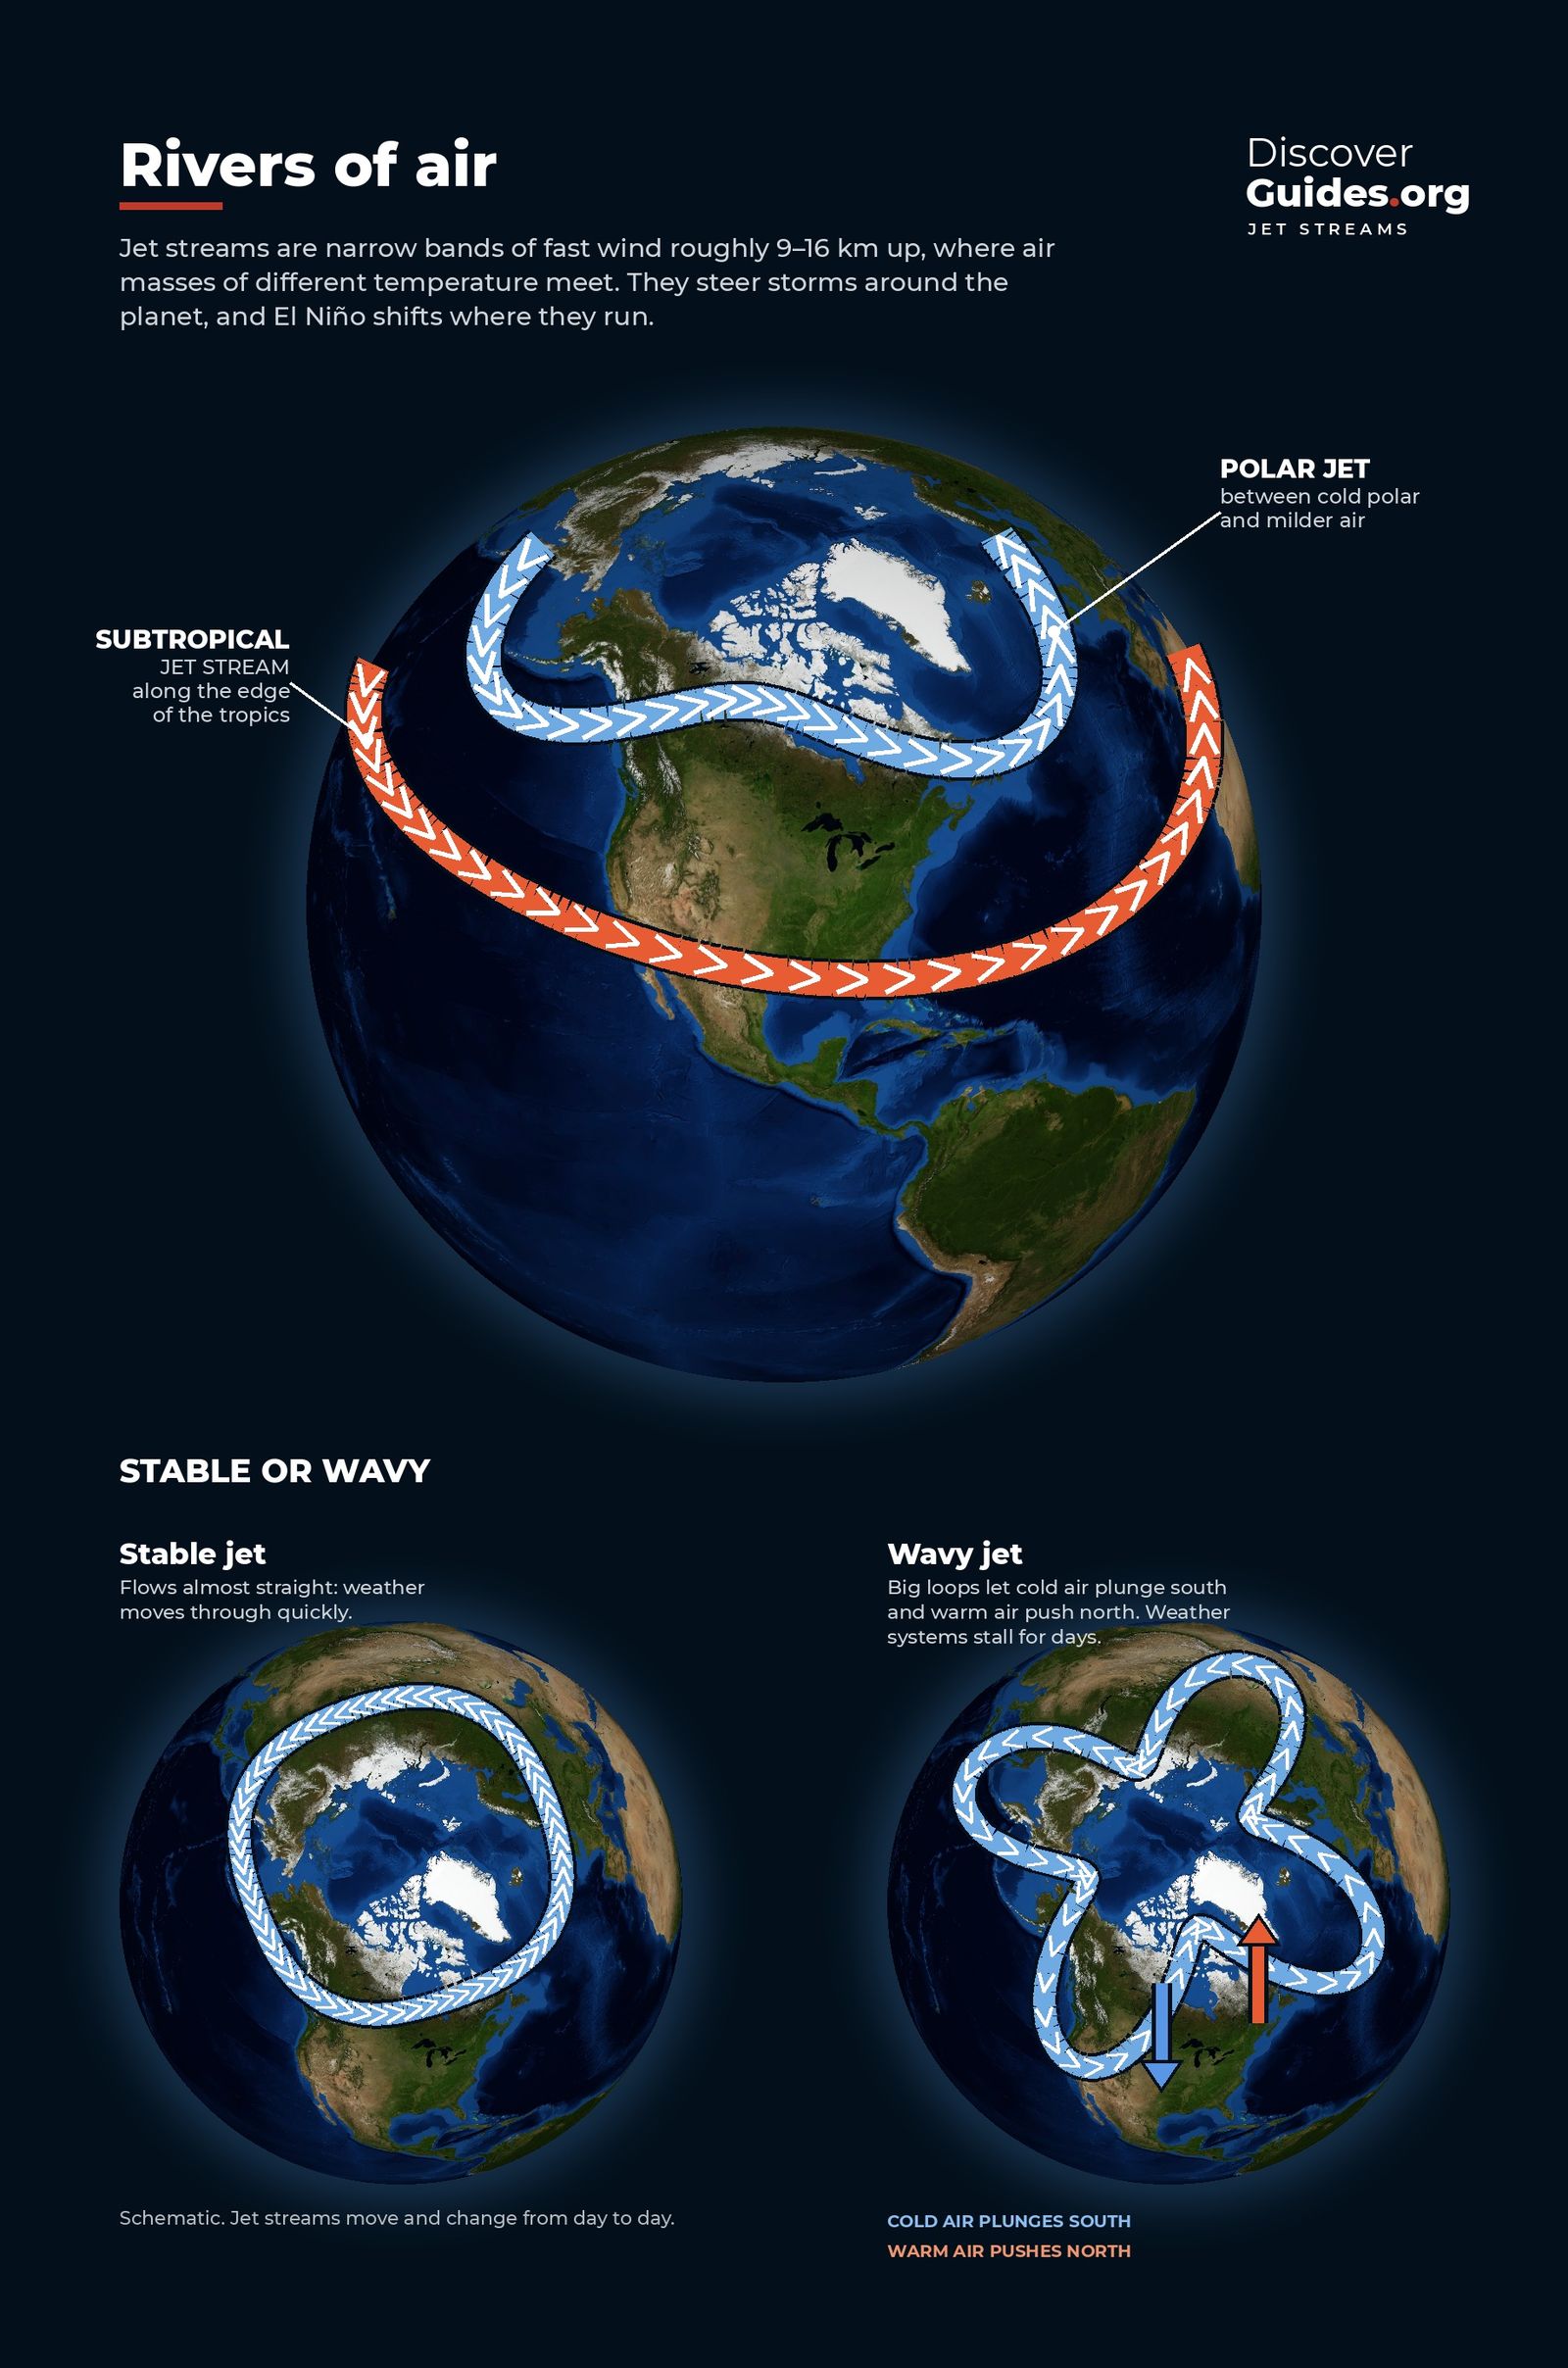
What is the jet stream?
The jet stream explained: polar and subtropical jets, how fast and high they blow, how they were discovered, and why El Niño and La Niña bend them.
El Niño basicsWhat is the ITCZ?
The Intertropical Convergence Zone explained: where the trade winds meet, why it brings daily thunderstorms and the doldrums, how it moves with the seasons and with El Niño.
 Weather
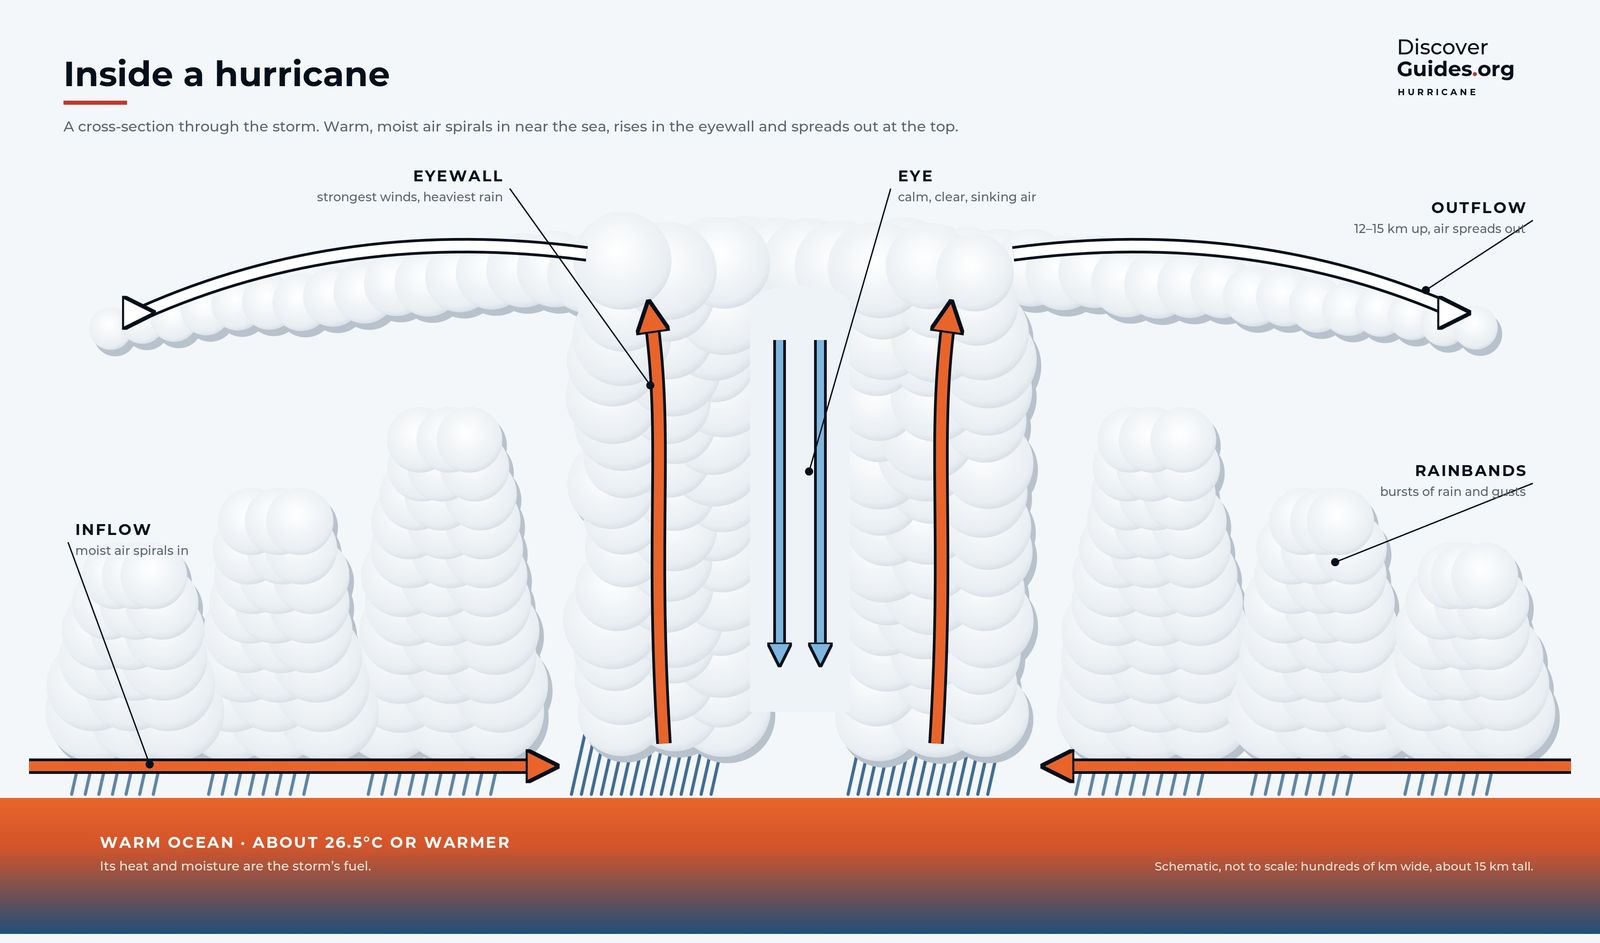
How do hurricanes work?
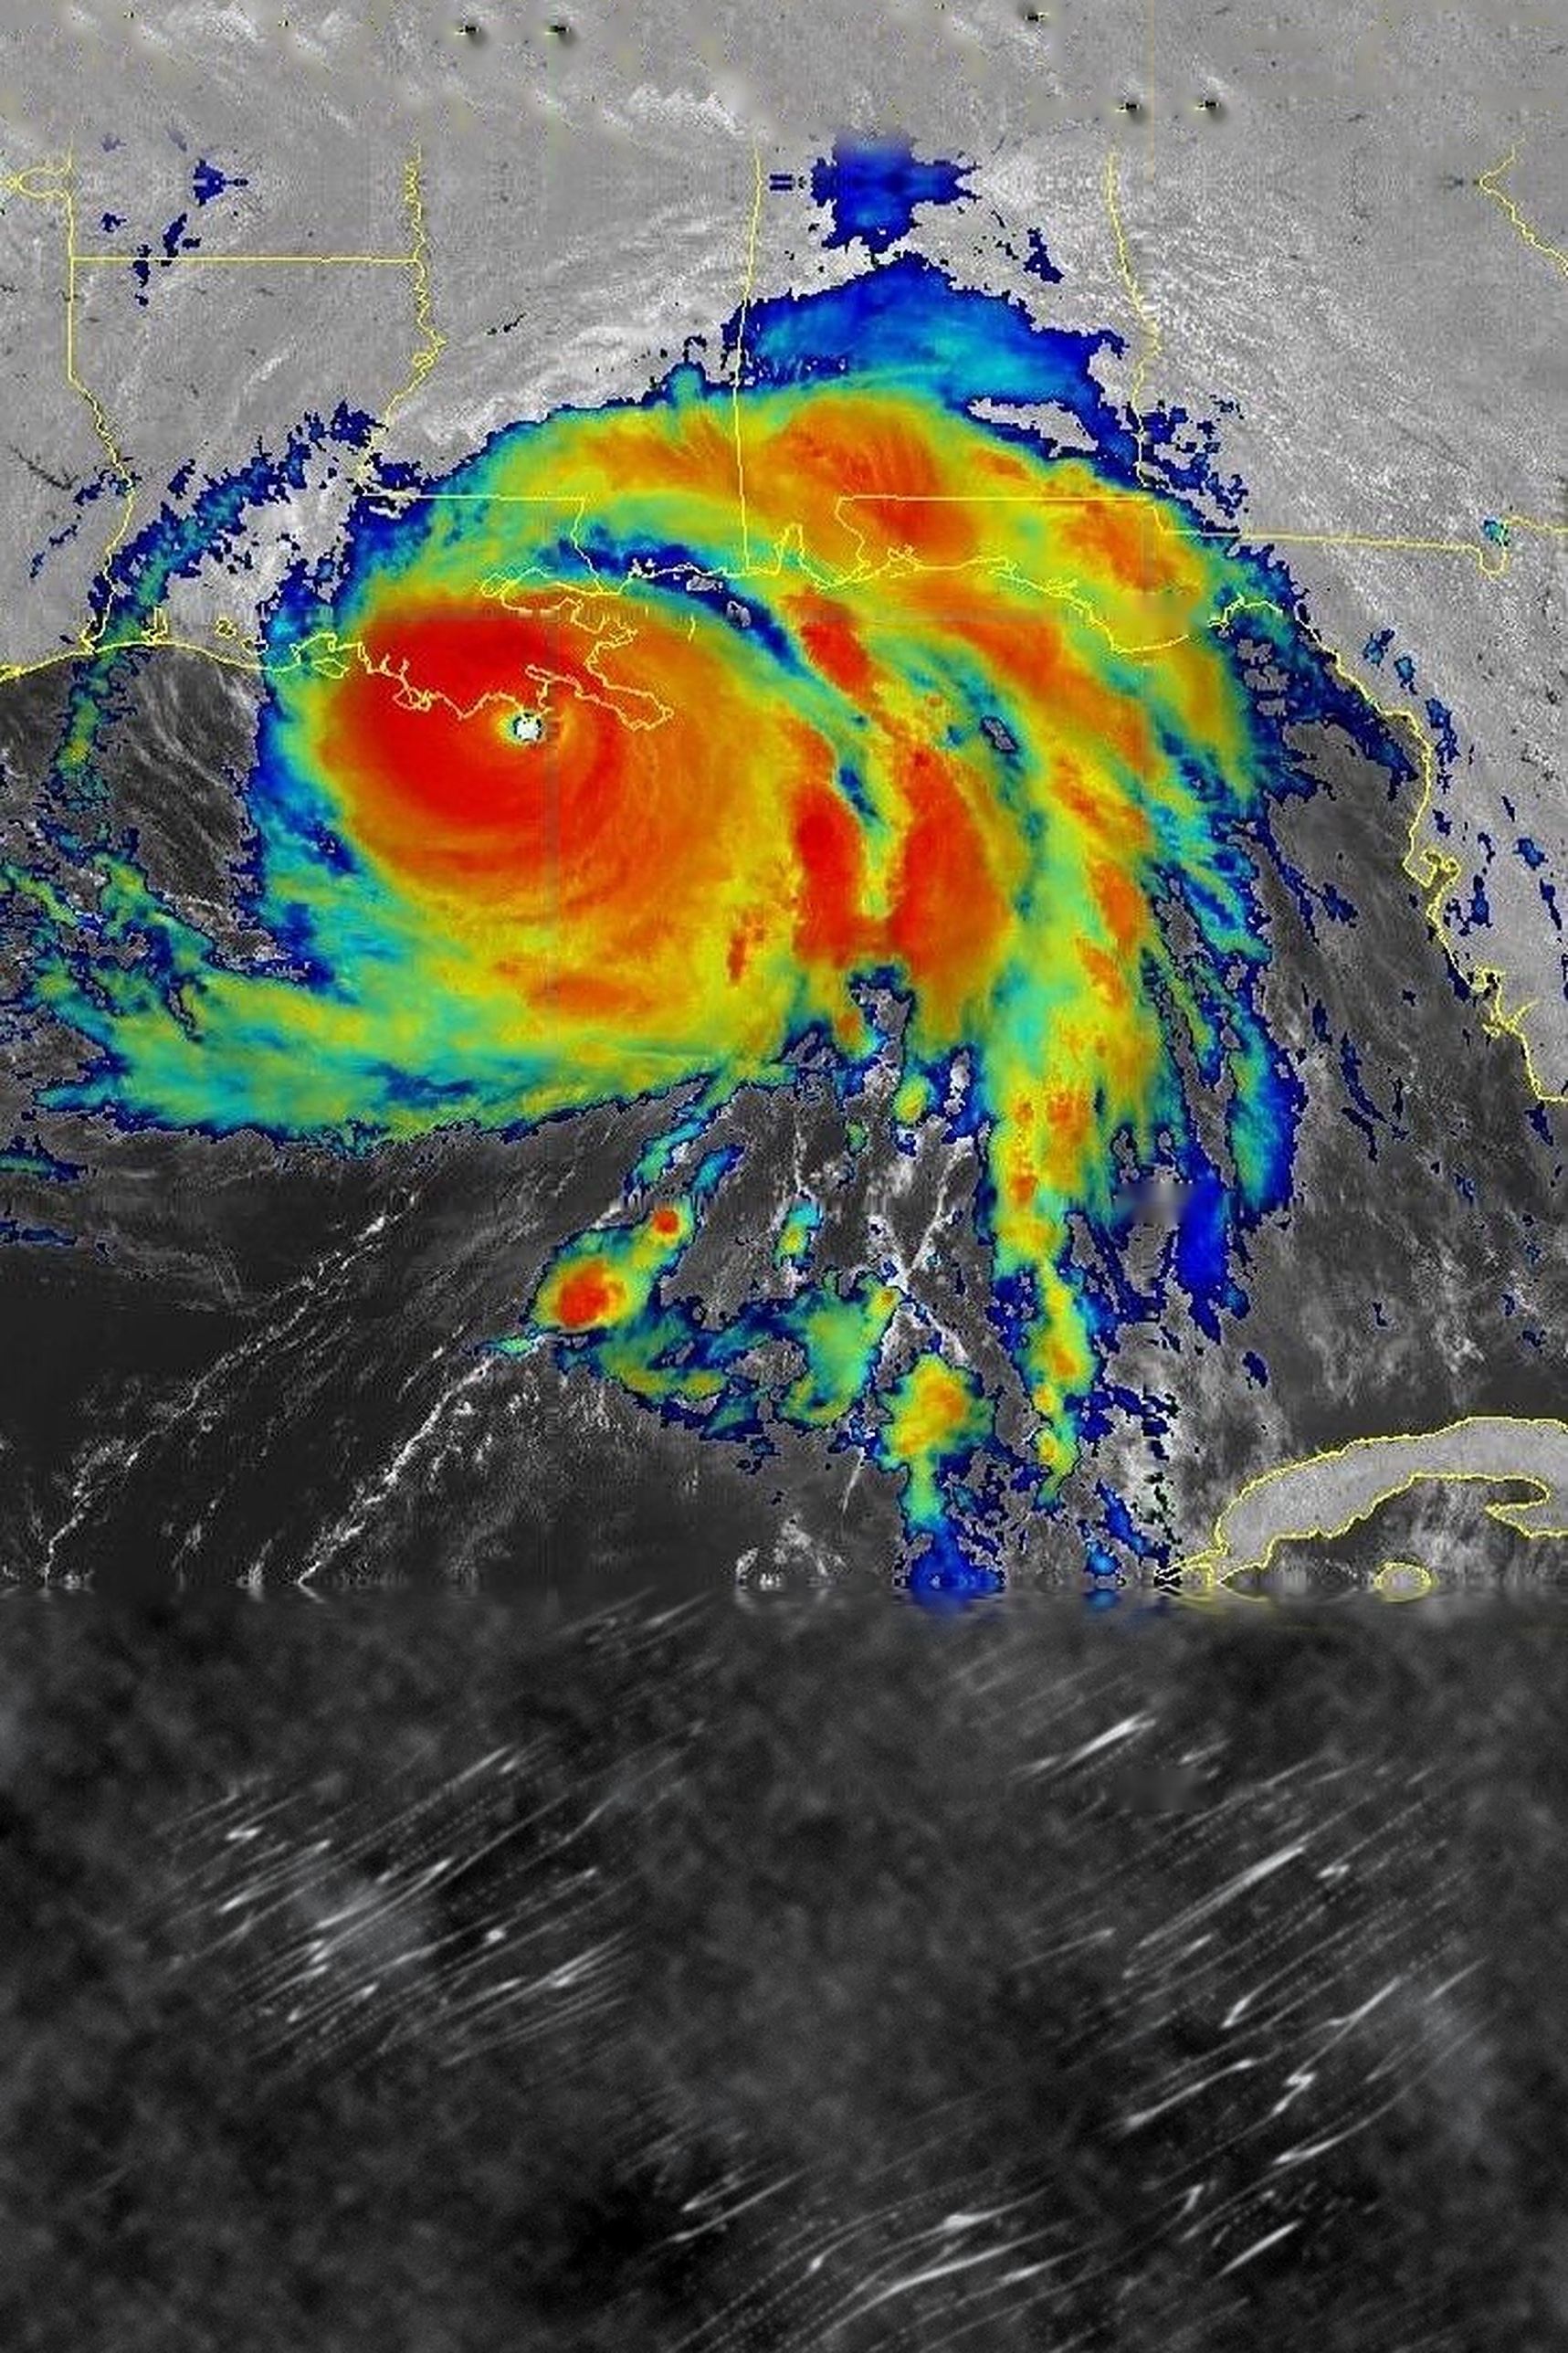
How hurricanes, typhoons and cyclones form: the six ingredients, the eye and eyewall, the Saffir-Simpson scale, rapid intensification, and El Niño's effect on each ocean.
 Weather
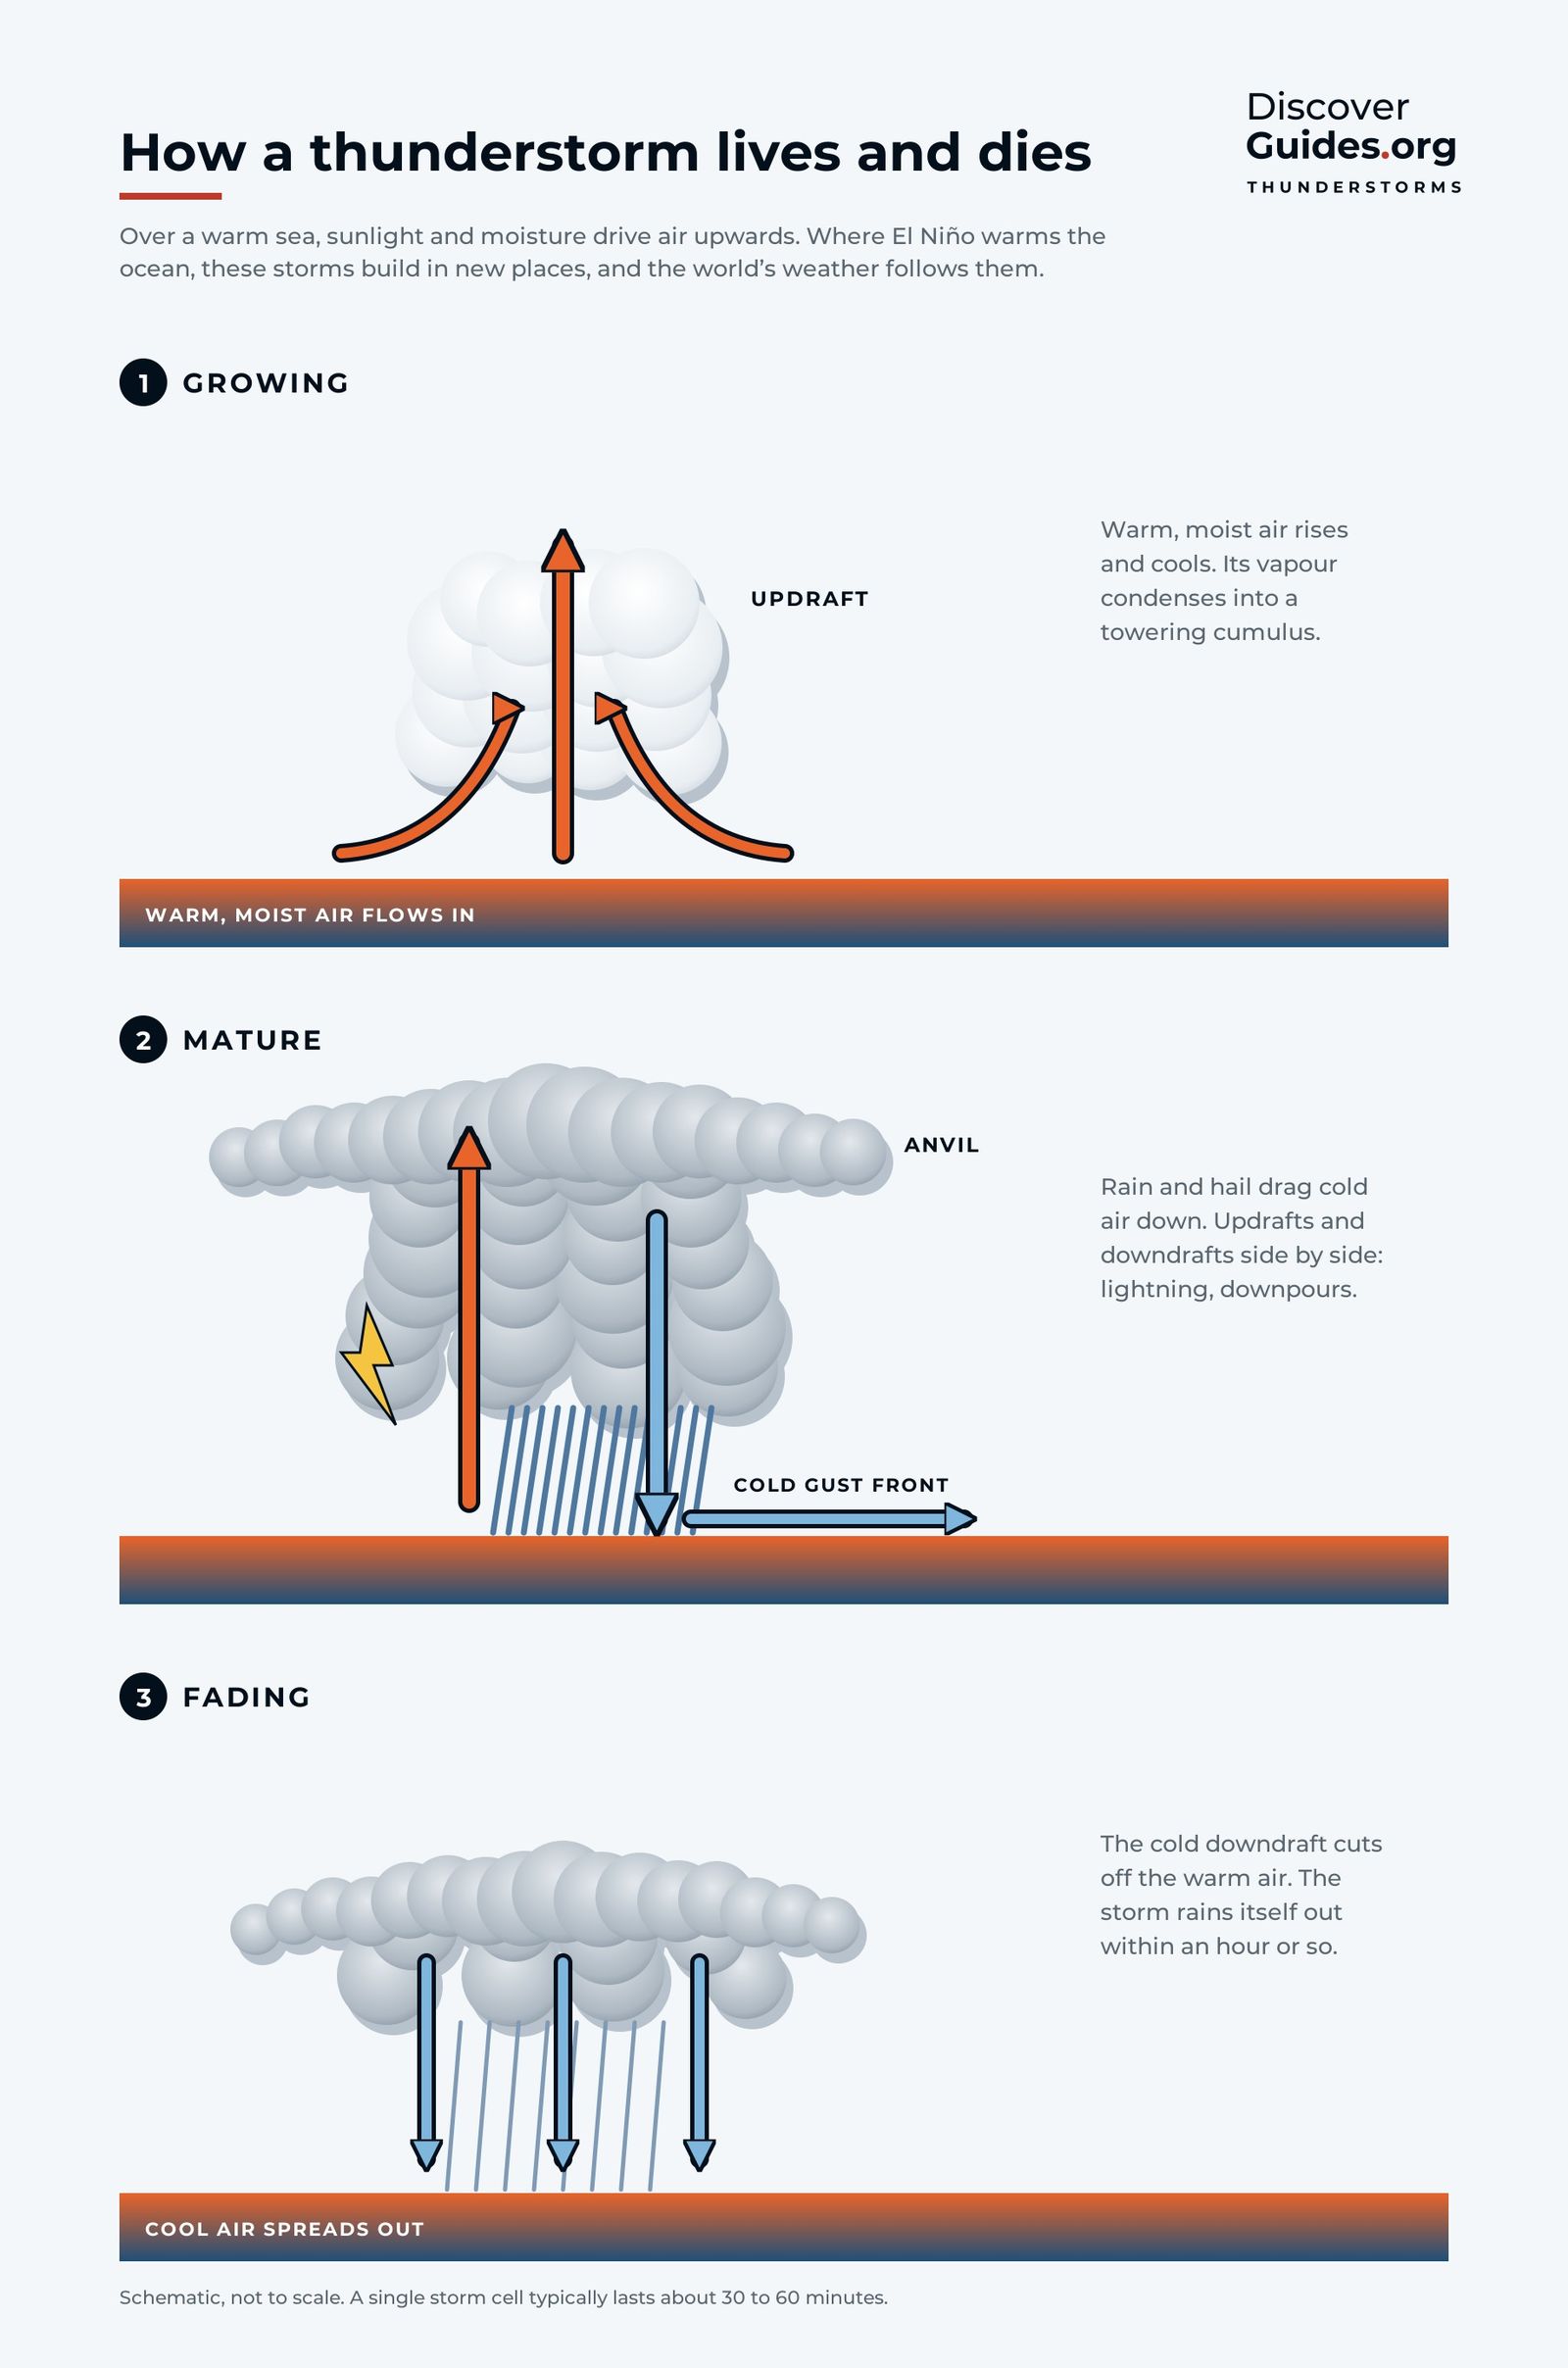
How do thunderstorms form?
How thunderstorms form and die in three stages, why some bring floods, and how El Niño lets storms erupt over normally dry deserts like the coast of northern Peru.
 El Niño basics
How is El Niño measured?
How scientists measure El Niño: the four Niño regions, the Oceanic Niño Index, NOAA's new relative index (RONI) from 2026, and the weak-to-very-strong scale.
 El Niño basics
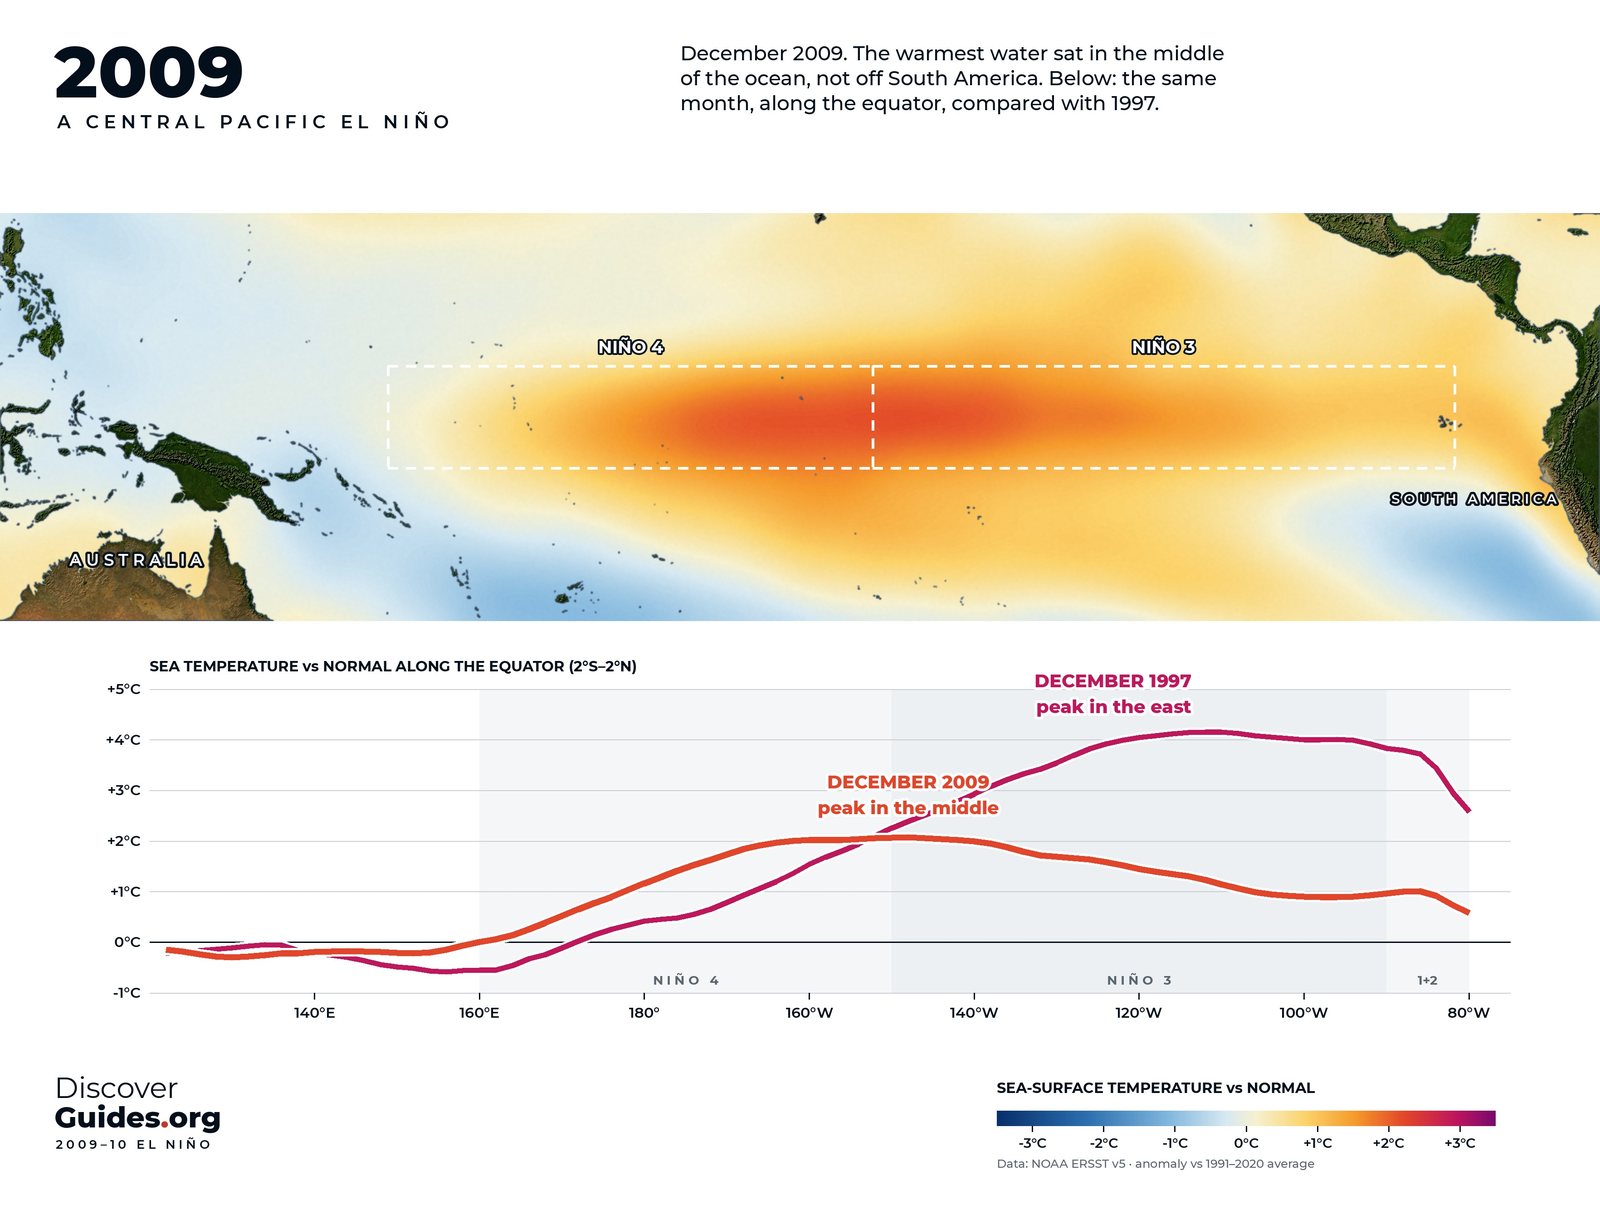
What is El Niño Modoki?
Central Pacific El Niño, or El Niño Modoki, explained: how it differs from classic eastern events, the record 2009-10 event, and its links to hurricanes and monsoons.
 History
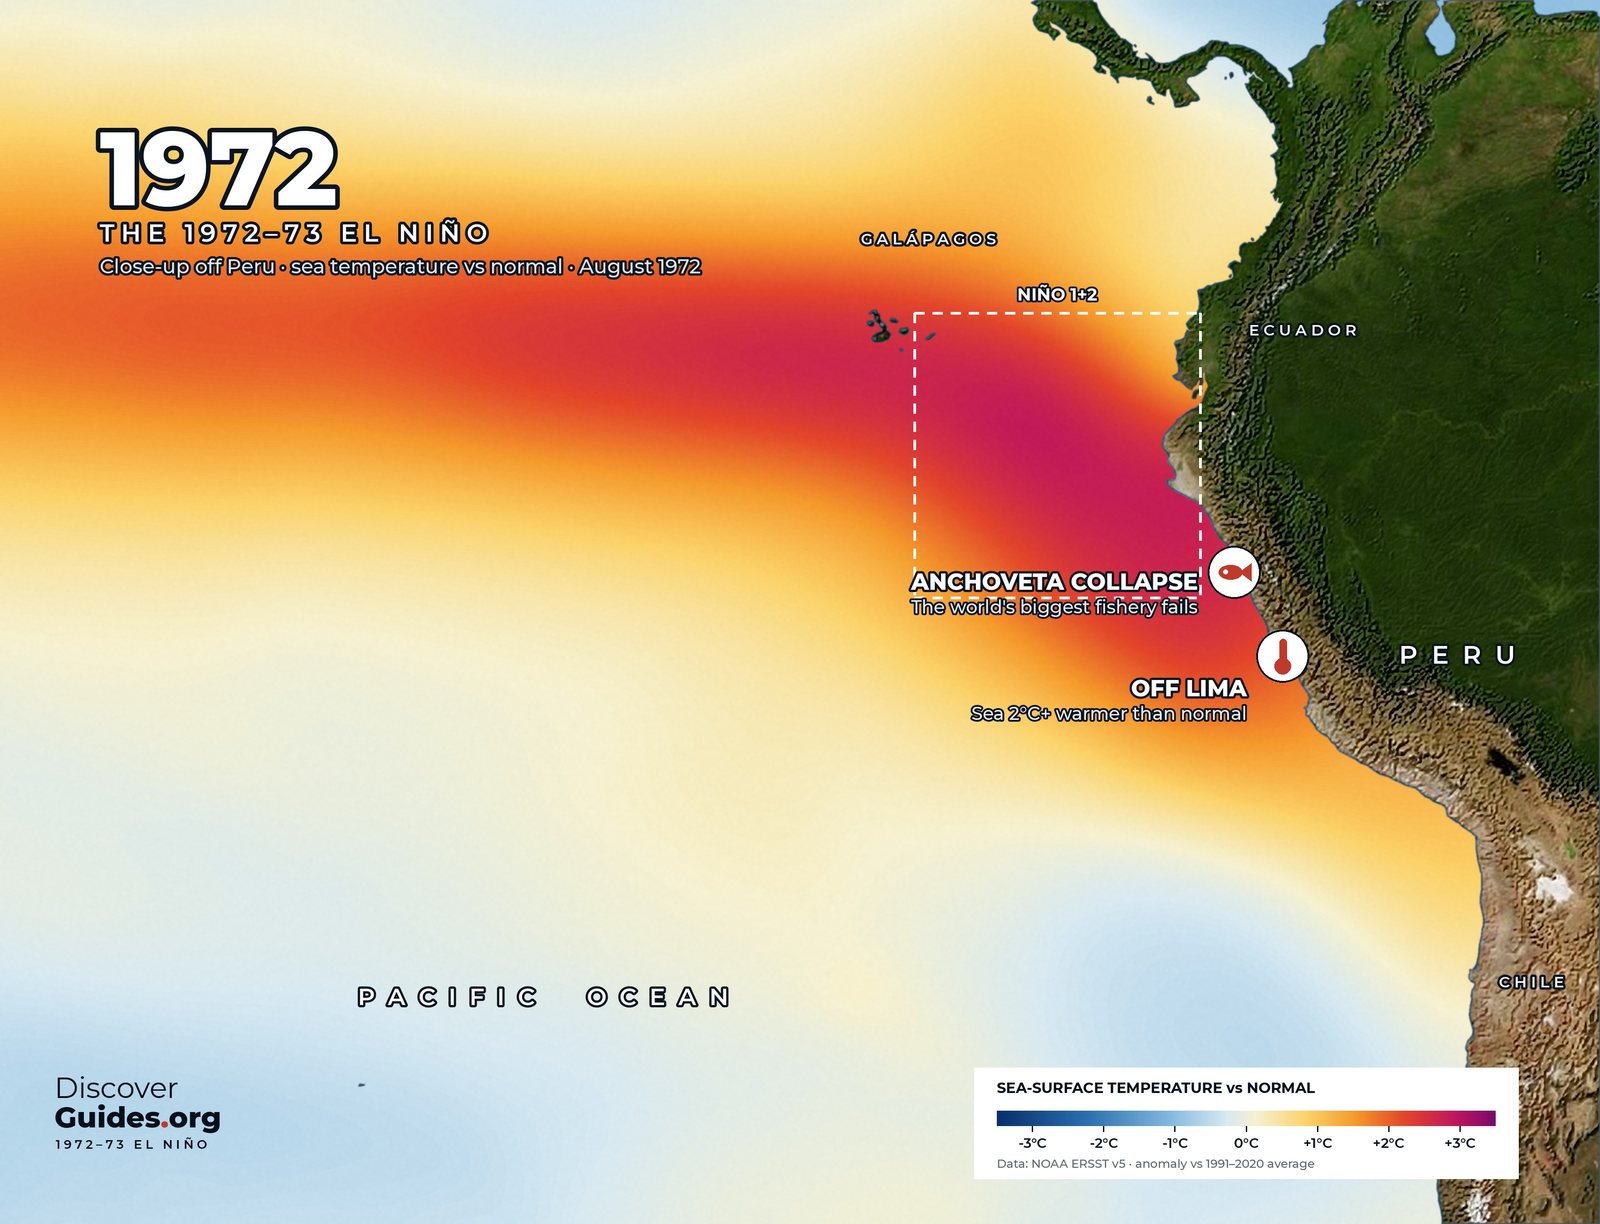
El Niño 1972-73
The 1972-73 El Niño and the collapse of Peru's anchoveta, once a fifth of the world's fish catch: the catch, the guano birds, the La Niña that followed.
 El Niño basics
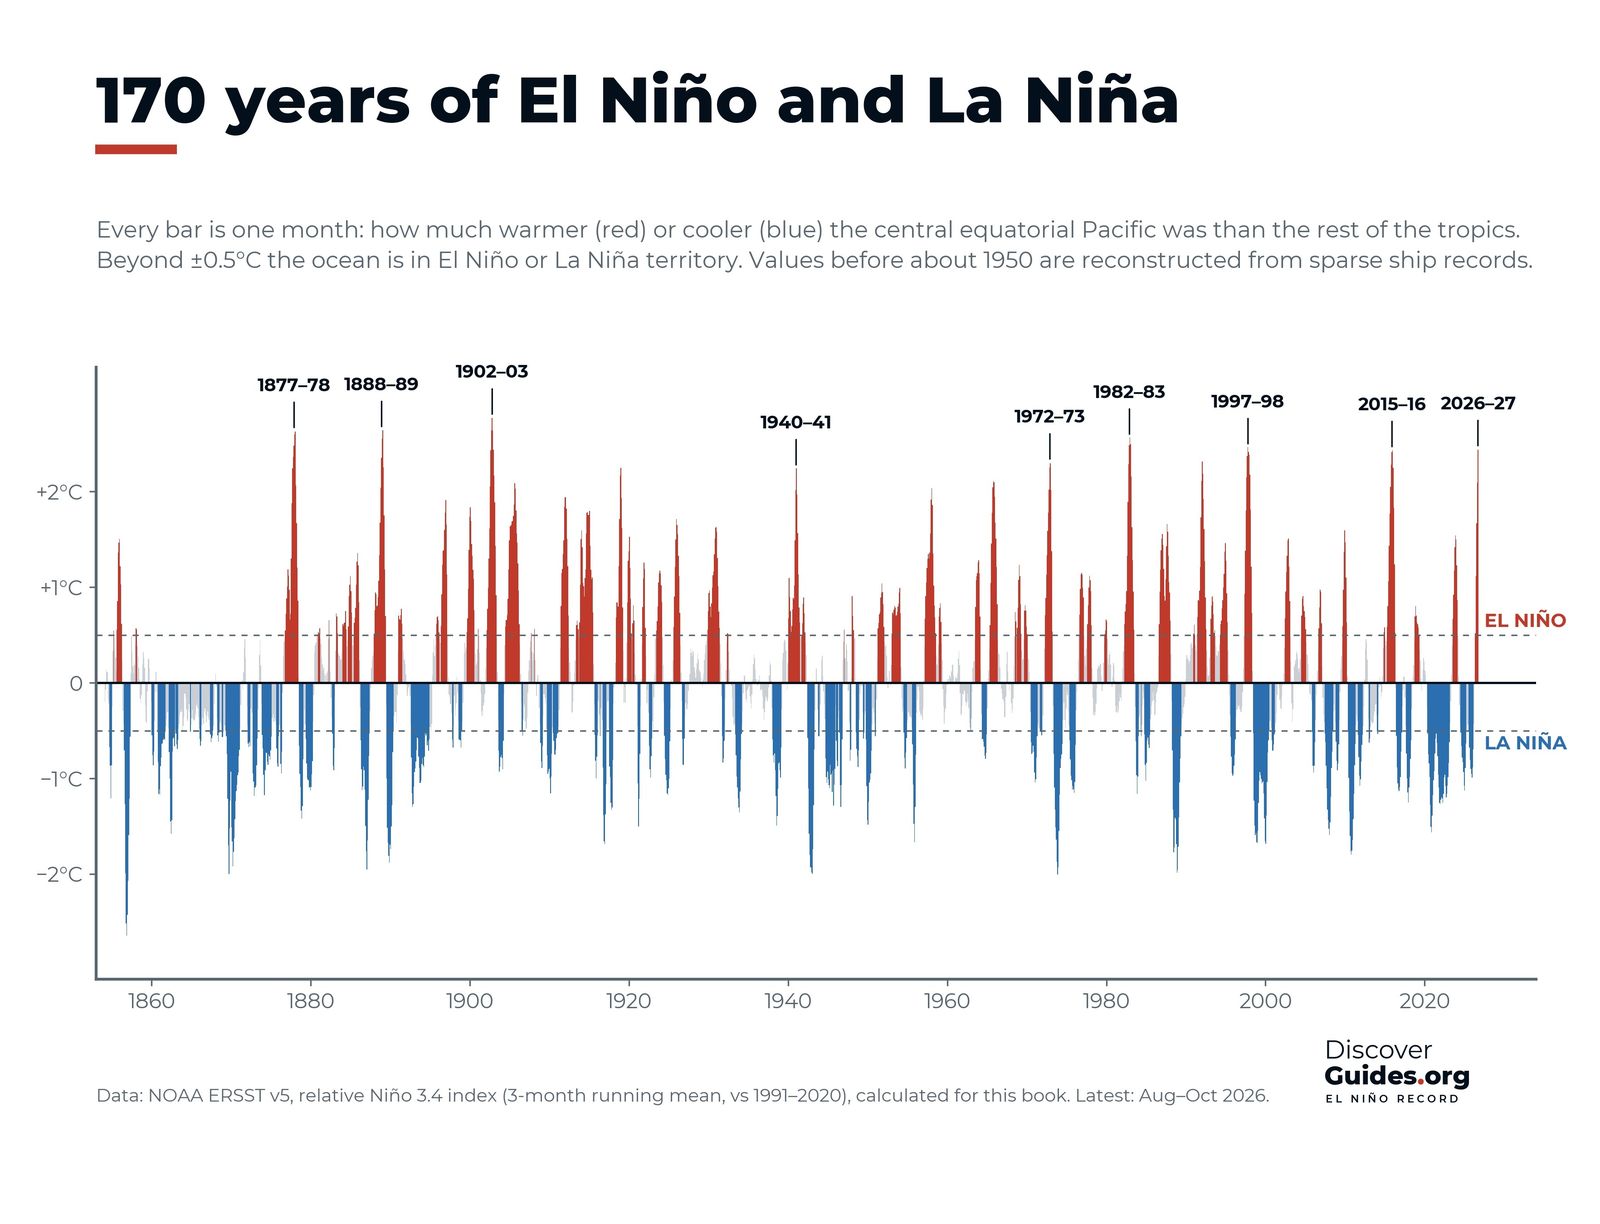
Who discovered El Niño?
The history of El Niño's discovery: Peru's warm Christmas current, Gilbert Walker's pressure see-saw, Bjerknes's 1969 breakthrough and the buoys that followed.
 History
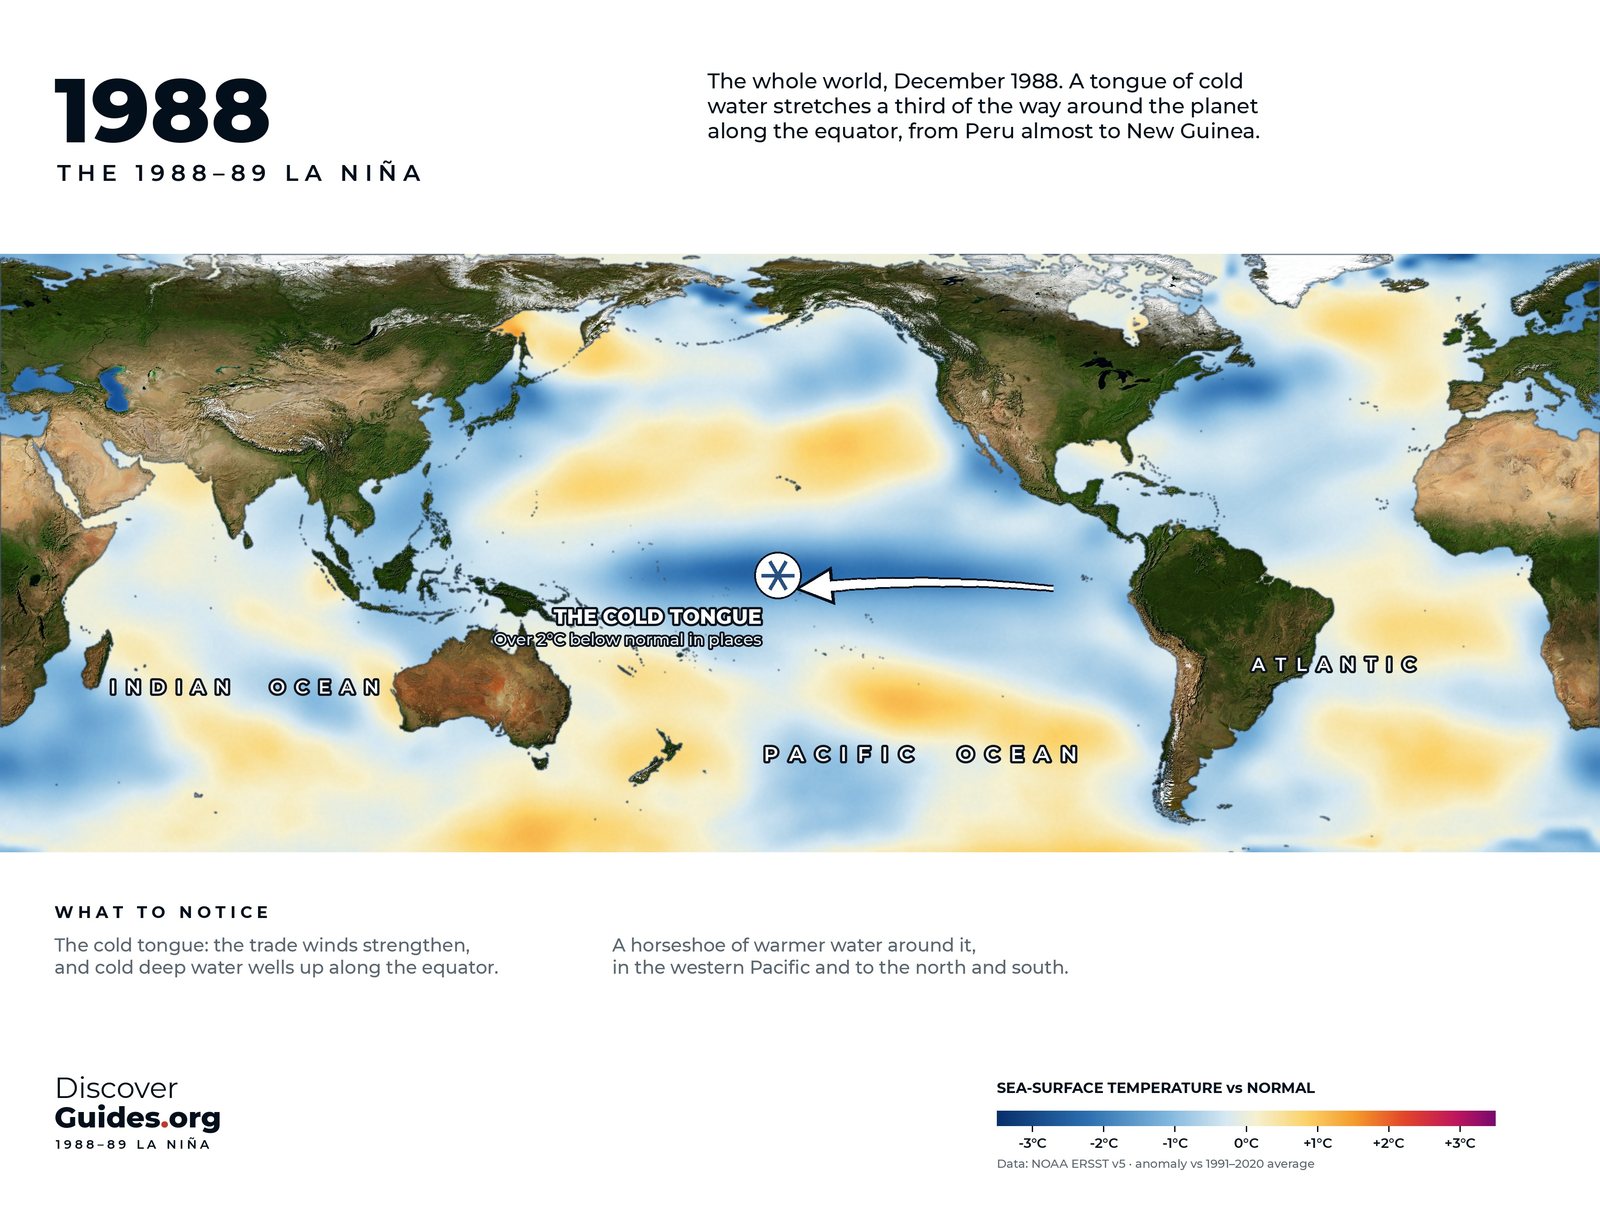
The strongest La Niñas
The strongest La Niñas since 1950, from 1973-76 and 1988-89 to 2010-11: how cold the Pacific got, why La Niña lasts longer than El Niño, and what it does.
 History
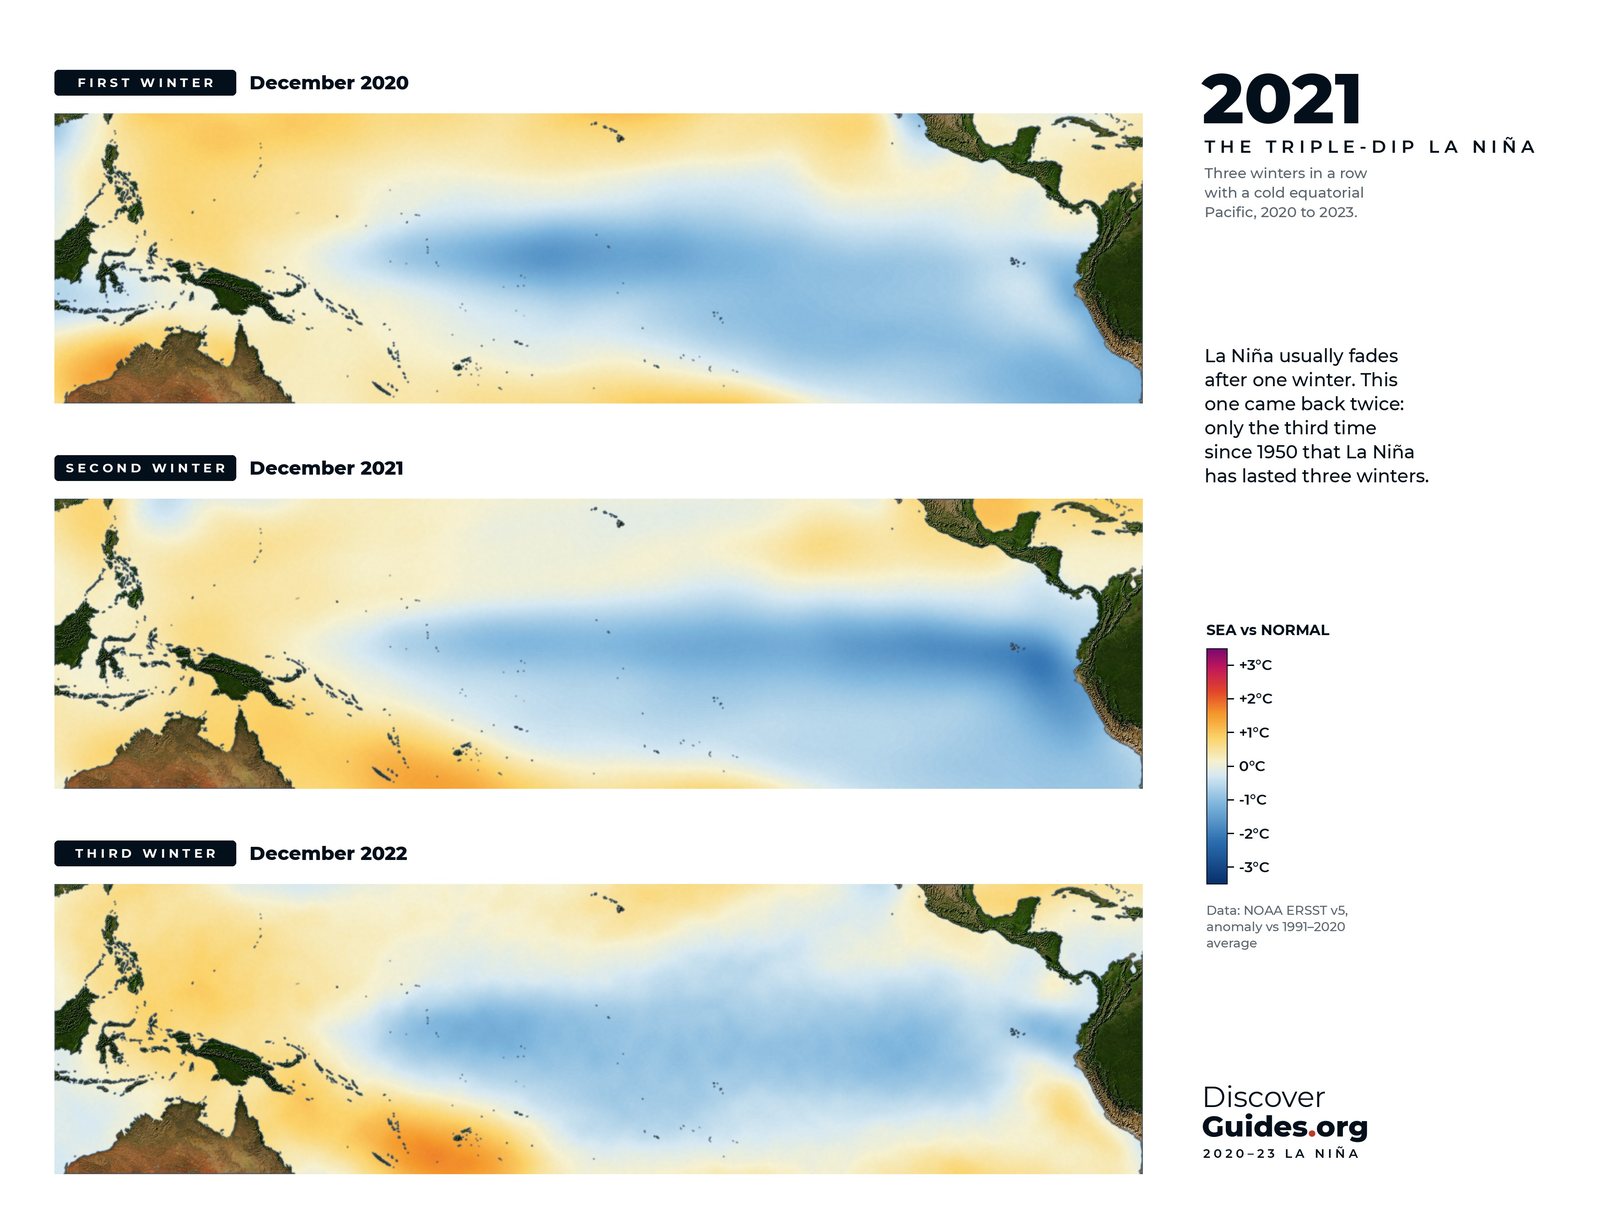
The triple-dip La Niña
The 2020-23 triple-dip La Niña: record floods in Australia, five failed rainy seasons in the Horn of Africa, Pakistan's floods, a record hurricane season, and what came next.
 Weather
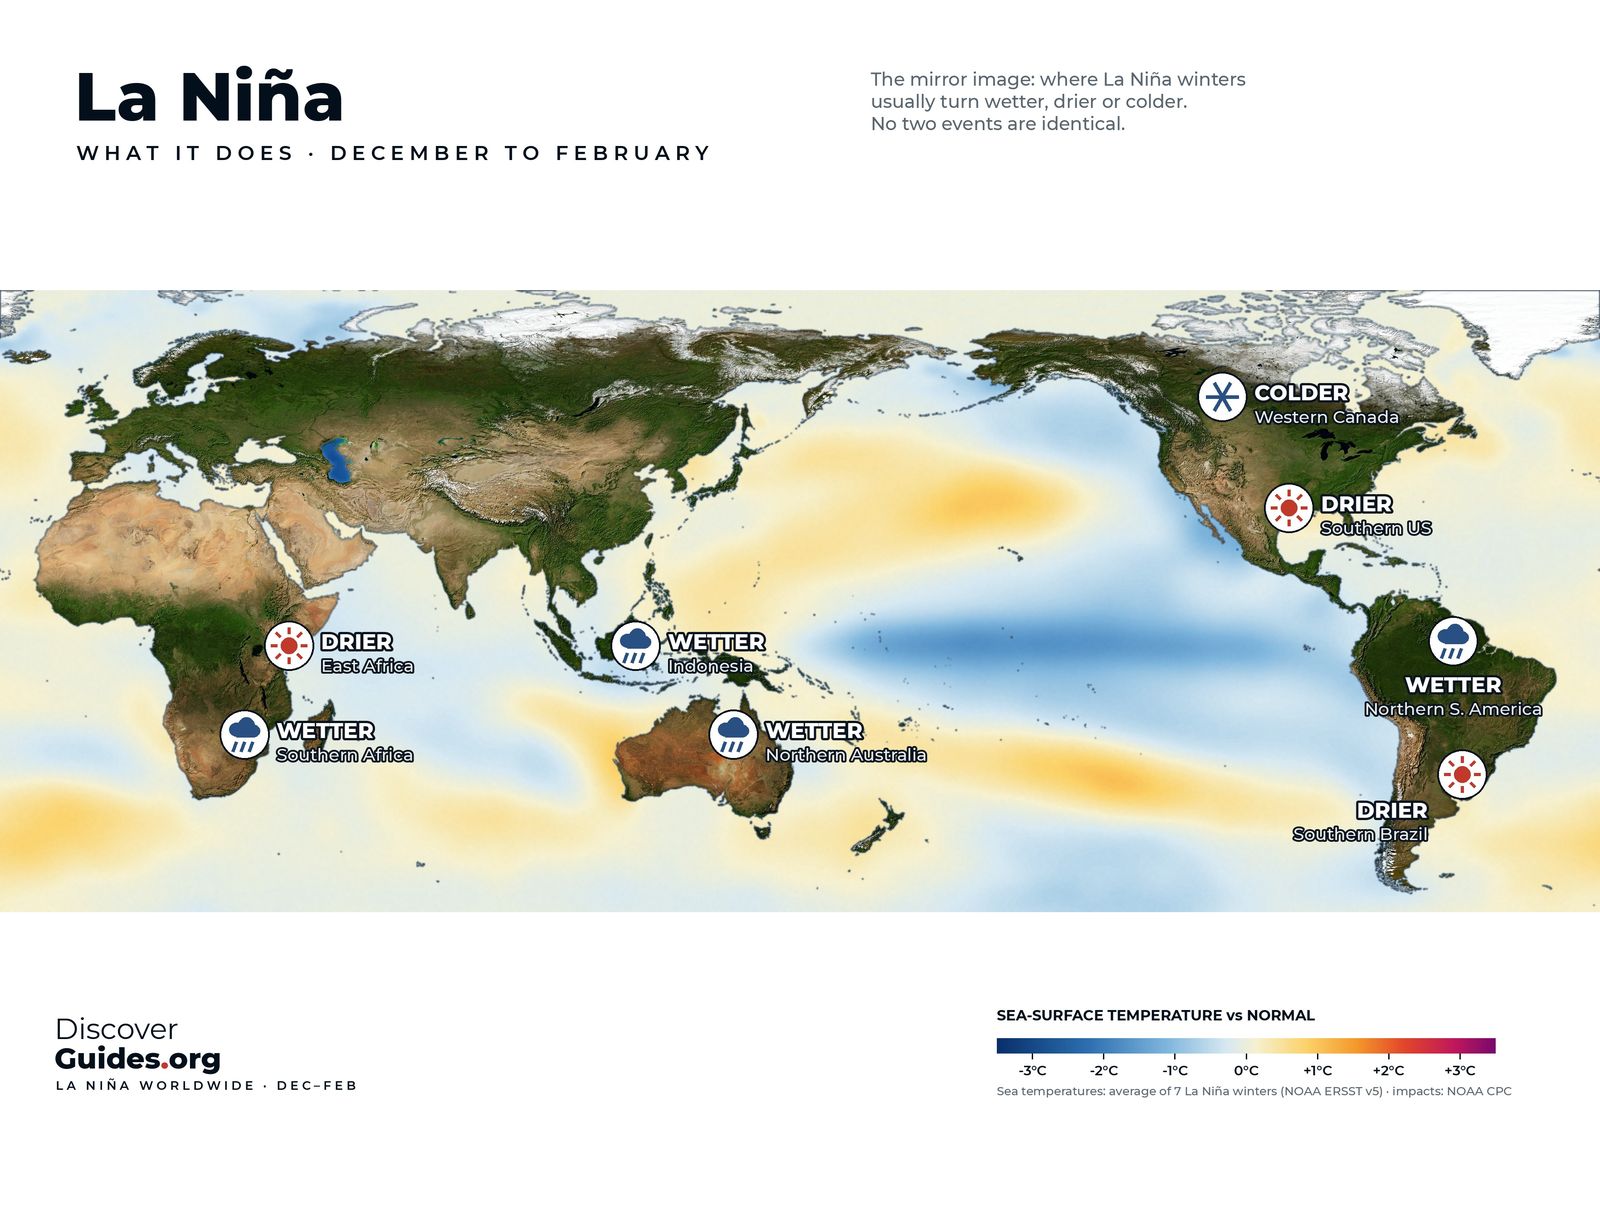
La Niña's world weather
La Niña's typical effects region by region: wetter Australia and Indonesia, drier East Africa and southern US, more Atlantic hurricanes, and how reliable each signal is.
 Weather
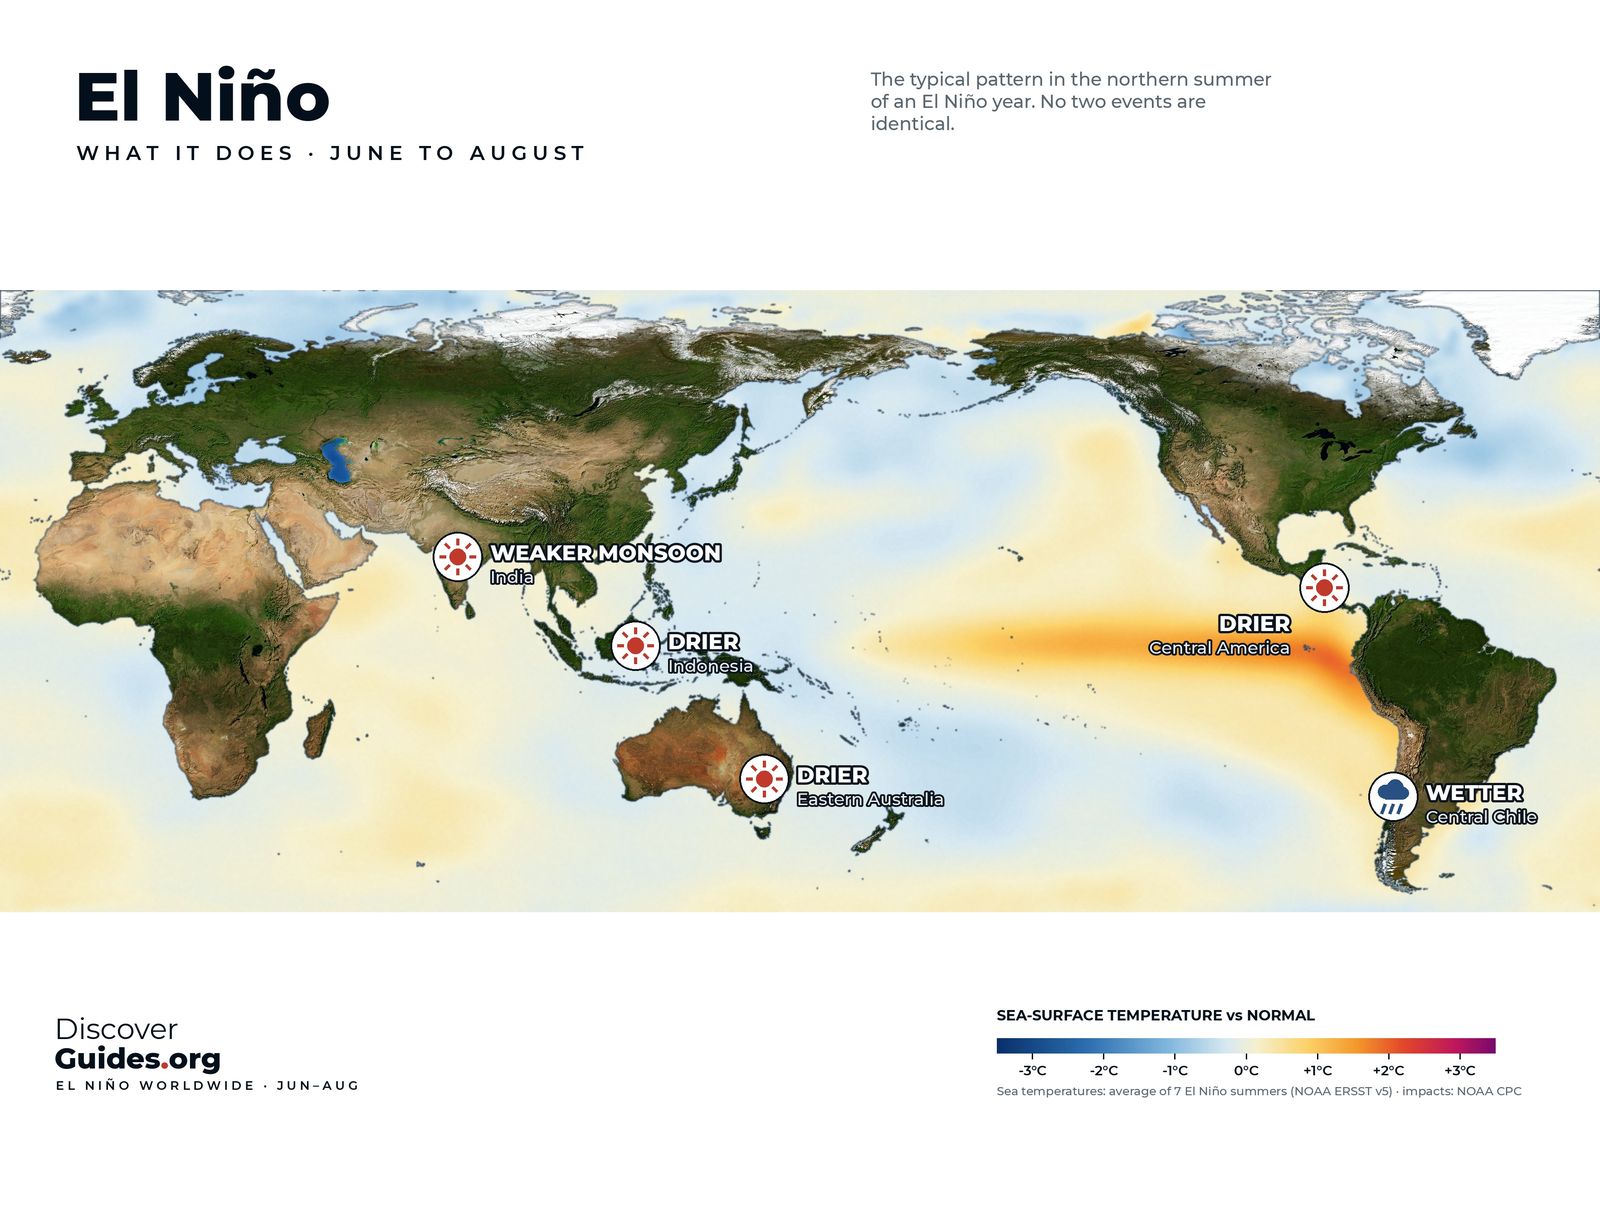
El Niño's June-August effects
El Niño's effects in the northern summer: drier eastern Australia and Indonesia, a weaker Indian monsoon, wetter central Chile, and why North America feels little.
 History
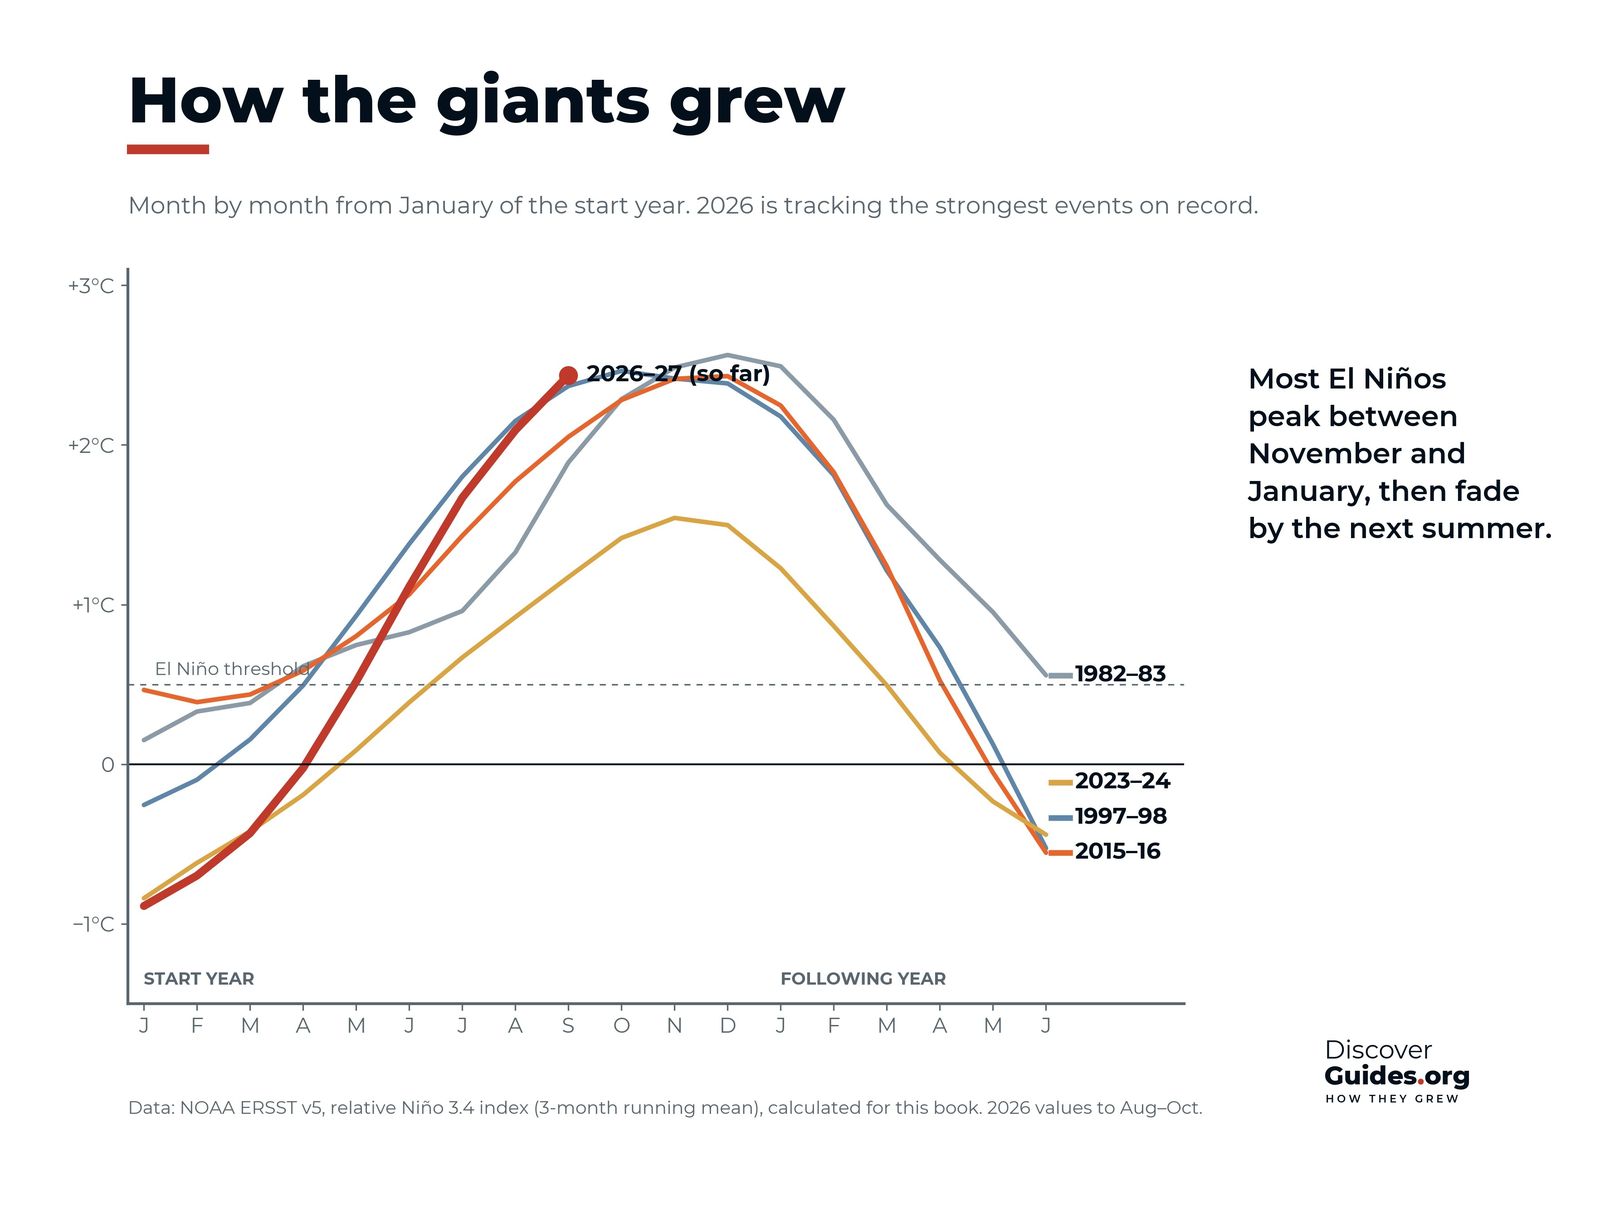
How super El Niños grow
How the giant El Niños of 1982-83, 1997-98, 2015-16 and 2026-27 grew month by month, what made them so strong, and how fast they collapsed.
WeatherWhat is a coastal El Niño?
The coastal El Niño explained: warming confined to Niño 1+2 off Peru and Ecuador, the 2017 floods, Peru's ENFEN alerts in 2026 and El Niño insurance that pays before the rain.
 Weather
El Niño and the monsoon
How El Niño weakens the Indian monsoon, why the Indian Ocean Dipole can cancel or amplify it, and what happened in the 2026 monsoon region by region.
WeatherEl Niño in Australia
What El Niño means for Australia: drier winter-spring rain, the Murray-Darling Basin, bushfire risk, frost, snow and cyclones, and why not every El Niño brings drought.
WeatherEl Niño in southern Africa
Why El Niño dries southern Africa: the record-dry February of 2024, failed maize in Zambia, Zimbabwe and Malawi, Lake Kariba, and the 2015-16 regional disaster.
WeatherEl Niño fires and haze
How El Niño drought turns Indonesia's peat swamps into fuel: the 1997 and 2015 fires, the haze over South-east Asia, the health and economic cost, and the carbon released.
WeatherEl Niño and the Panama Canal
How El Niño drought lowers Gatún Lake and limits ships through the Panama Canal: the 2023 transit cuts, the 2026 draft limits, and why the canal runs on rain.
WeatherEl Niño and the Amazon
How El Niño dries the Amazon: the record-low Rio Negro at Manaus in 2023, river dolphin die-offs, cut-off communities, and why drought lets the rainforest burn.
Life in hot waterEl Niño and Galápagos wildlife
How El Niño hits Galápagos wildlife: penguin crashes, sea lion pups lost, marine iguanas that shrink, 97% coral mortality in 1982-83, and the finches that boomed.
People and economiesEl Niño and disease
How El Niño spreads disease: the dengue surge after 2023-24, cholera cycles in Bangladesh, Rift Valley fever after East Africa's floods, and how forecasts give warning.
People and economiesThe cost of El Niño
What El Niño costs: trillion-dollar losses that last five years, winners and losers, rice and maize prices, Peru's GDP losses, and how acting early cuts the bill.
El Niño basicsEl Niño and climate change
Will climate change bring more super El Niños? What the IPCC says, extreme events, whether ENSO has already changed, the cold-tongue puzzle, and records on a rising line.
The Discover list
Be first when
El Niño lands.
One email when Discover El Niño is out, plus each new Discover book after it. No spam, unsubscribe any time.