At a glance
A false start and a big finish
Forecasters expected an El Niño in 2014. Warm water built up below the surface and the central Pacific warmed, but the trade winds never collapsed and the atmosphere did not respond, so the event stalled. In 2015 it took off: NOAA declared El Niño conditions in March 2015, and the event strengthened through the year to peak between November 2015 and January 2016.
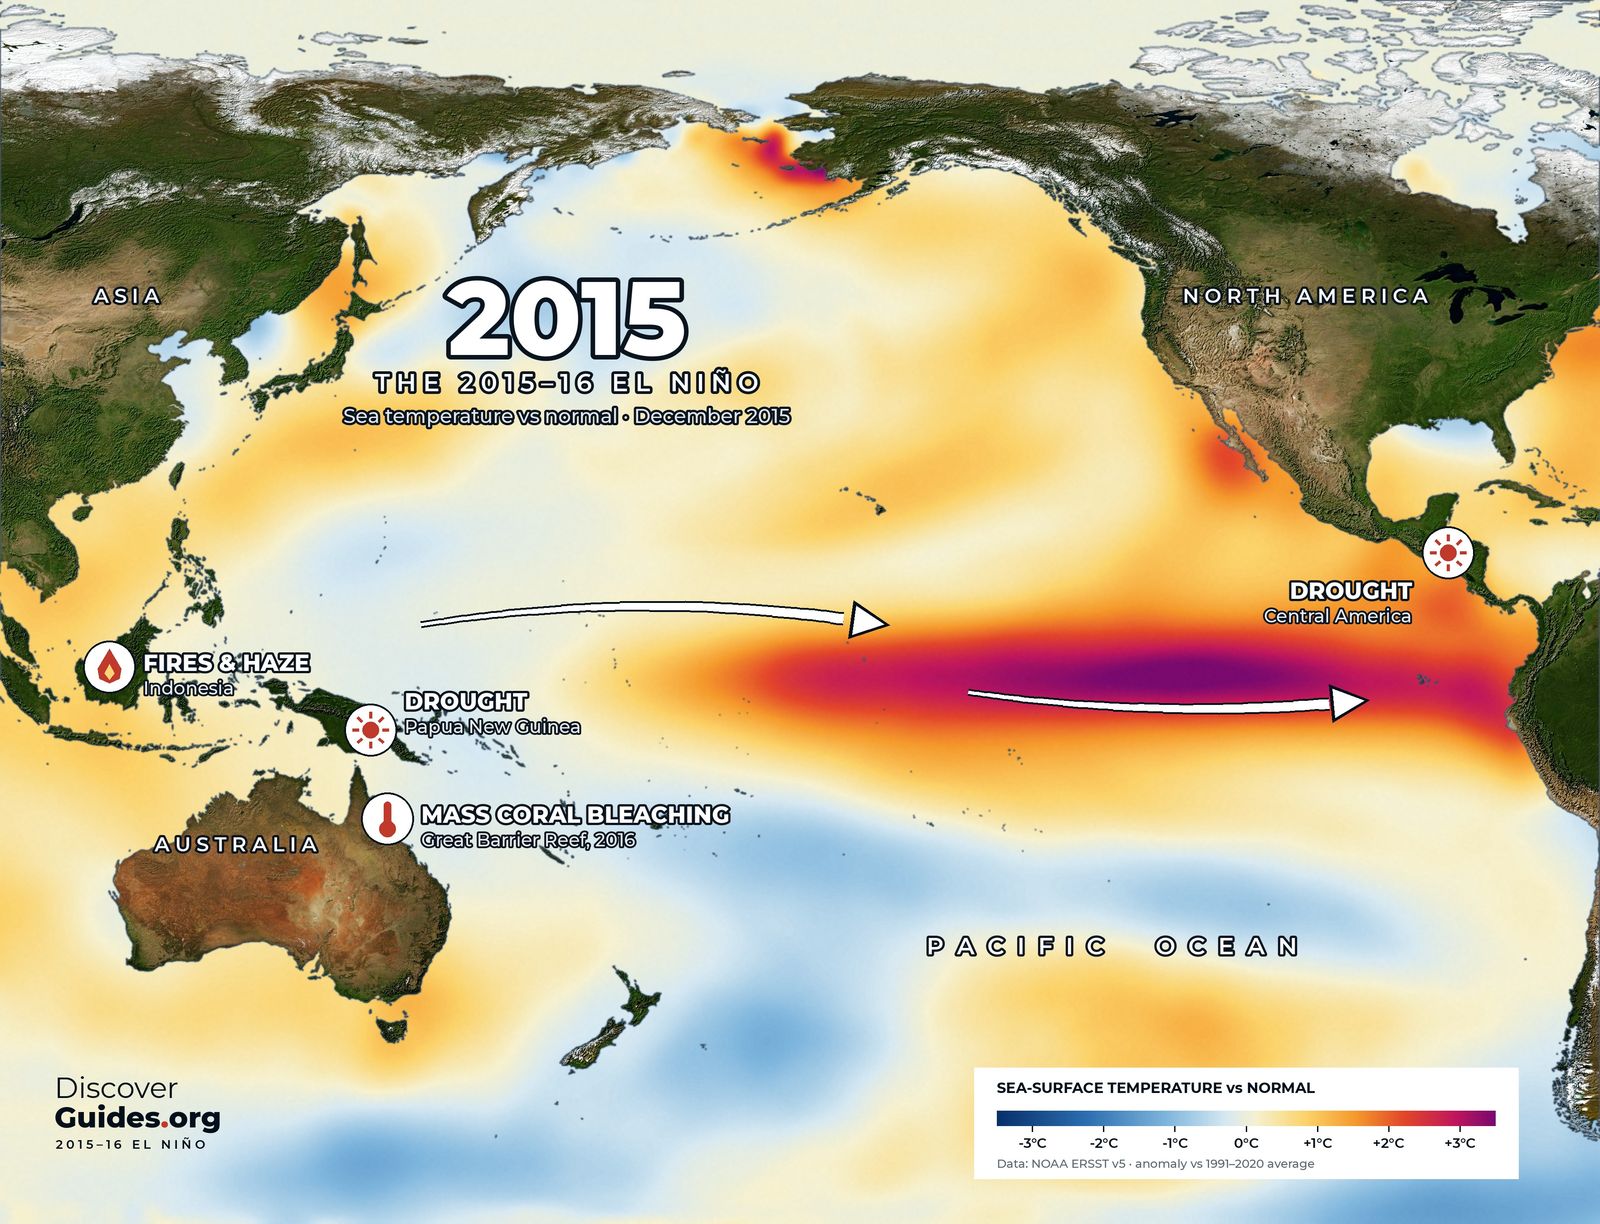
The map above shows December 2015. The core of warm water sits a little farther west than in 1997, across the central and eastern Pacific rather than hard against South America. A second warm patch lies in the north-east Pacific, part of the long marine heatwave of 2014-16 that scientists nicknamed the Blob.
Two numbers, one giant
On NOAA's traditional Oceanic Niño Index, 2015-16 peaked at about +2.6°C (4.7°F) over November to January, the highest value since records in that series began in 1950. On the relative index NOAA adopted as its main measure in 2026, it peaked at about +2.3°C, level with 1997-98 and just behind 1982-83.
The gap is the point of the new index. The relative index compares the central Pacific with the tropics as a whole, and by 2015 the whole tropical ocean was warmer than in the 1980s. Part of 2015-16's record on the old index was background warming rather than El Niño itself.
Fire and haze
Indonesia took the hardest blow. Drought dried out drained peatlands on Sumatra and Borneo, and fires, many lit to clear land, burned out of control from June to October 2015. Government figures put the area burned at about 2.6 million hectares. The World Bank estimated the cost at no less than US$16.1 billion, about 1.9% of Indonesia's economy that year and more than twice the cost of rebuilding after the 2004 tsunami. Smoke and haze spread over Singapore, Malaysia and beyond.
Drought from the Pacific to Africa
- Papua New Guinea. Drought and highland frosts destroyed crops and dried up water supplies in 2015.
- India. A weak monsoon in 2015, the second below-normal monsoon in a row.
- Central America. Drought across the Dry Corridor hit maize and bean harvests.
- Ethiopia. One of the worst droughts in decades left millions in need of food aid.
- Southern Africa. The 2015-16 rainy season was one of the driest on record across much of the region, with failed harvests from South Africa to Malawi.
Heat that arrived late
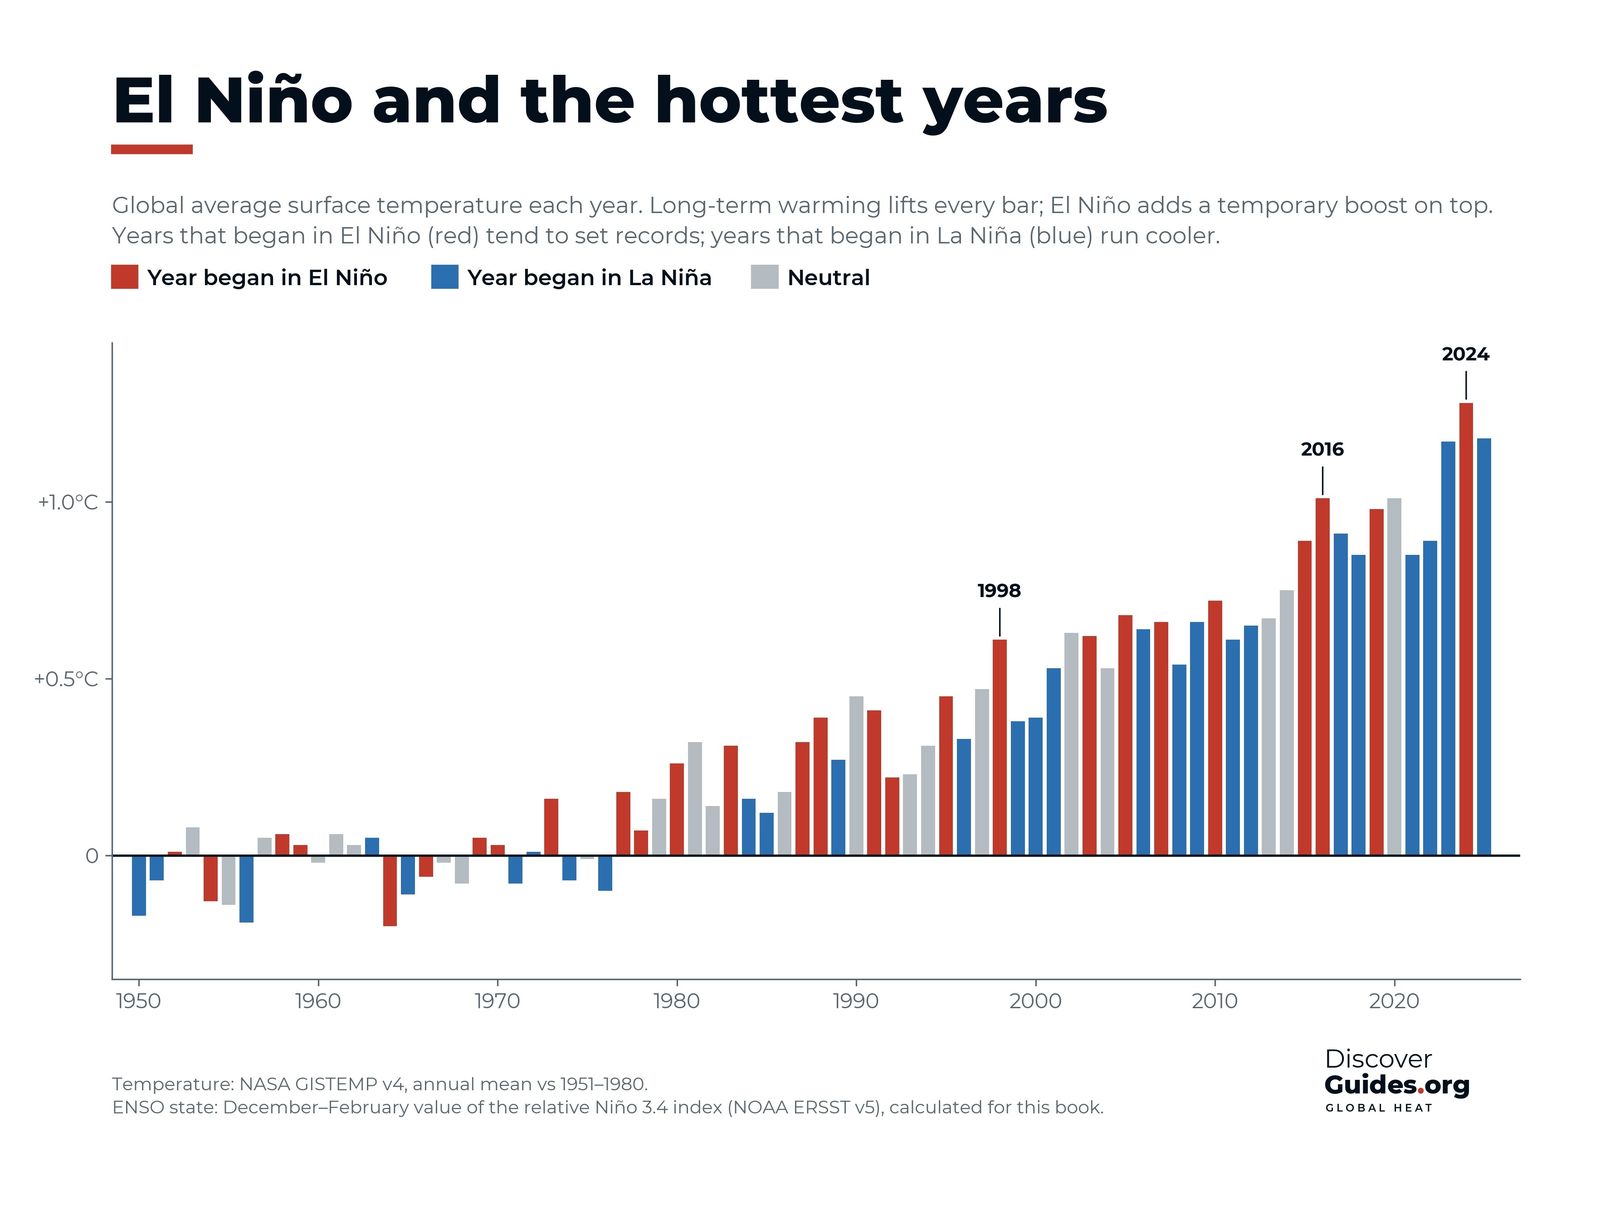
Global temperature peaks a few months after El Niño does, because the heat stored in the Pacific takes time to escape into the atmosphere. 2015 was already the warmest year on record by then, and 2016, the year after the peak, went higher still. NOAA and NASA both ranked 2016 as the warmest year in their records, the third record year in a row after 2014 and 2015.
The same lag explains why El Niño's effects often outlast its peak in the ocean. Heat stress on reefs, drought in southern Africa and record global temperatures all came in early 2016, when the Pacific itself was already starting to cool. The pattern is explained in El Niño and global temperature.
The Great Barrier Reef
The heat reached the reefs. 2016 brought the worst mass bleaching the Great Barrier Reef had seen. The Australian Institute of Marine Science found that in the northern third of the reef, on average more than half of the bleached corals died. A 2018 study in Nature estimated that about 30% of the corals on the whole reef died in the months after the heatwave. The damage was part of the third global bleaching event, which ran from 2014 to 2017. The biology behind it is in El Niño and coral bleaching.
Storms, and a winter that disappointed
In October 2015 Hurricane Patricia became the strongest hurricane on record in the Western Hemisphere, with sustained winds of about 345 km/h (215 mph) off western Mexico, and the central Pacific around Hawaii had a record-busy season. Both fit El Niño's habit of favouring storms in the eastern and central Pacific.
California, braced for a repeat of 1997-98, got a dry winter in the south. A later NOAA-led study concluded that random weather variability, not a failure of the El Niño signal, was mostly to blame. It is the best-known reminder that El Niño shifts the odds rather than fixing the outcome (see El Niño and California).
What 2015-16 tells us about 2026-27
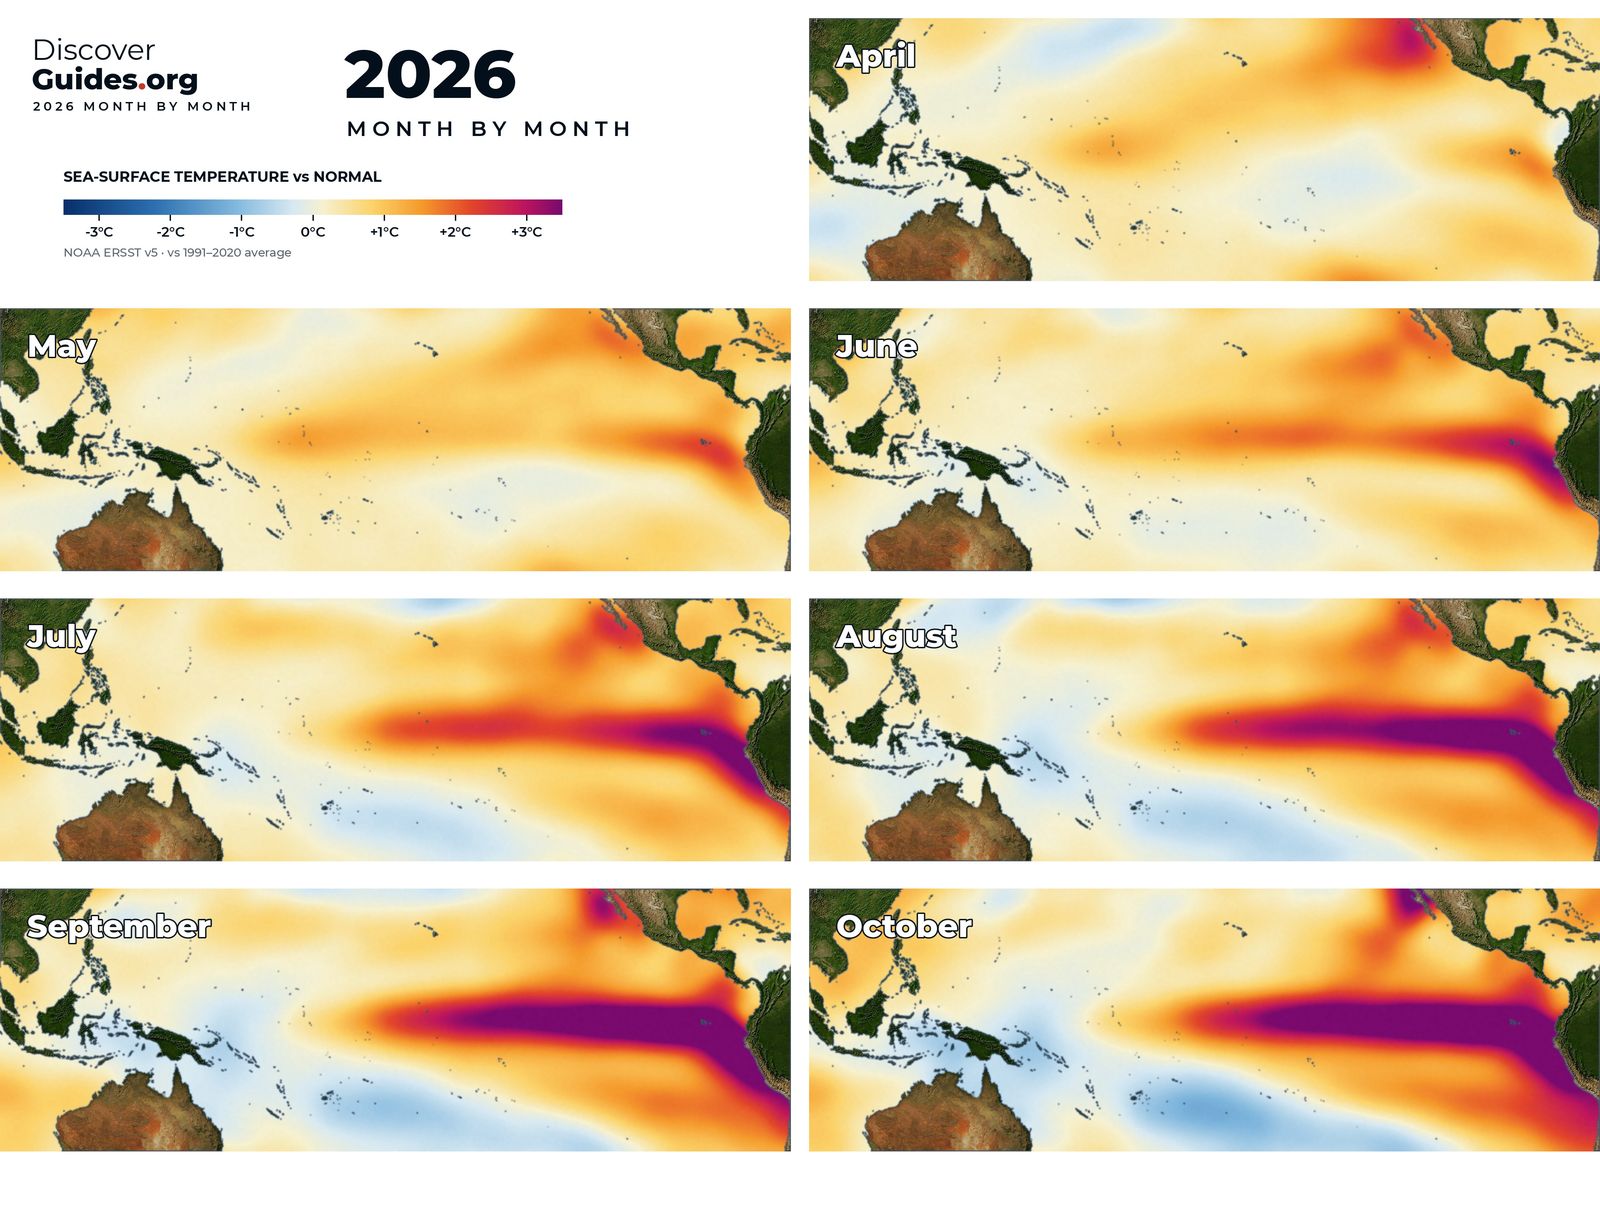
2015-16 showed how a giant El Niño on a warmer planet reaches further: into fire seasons, coral reefs and global temperature records. As of NOAA's October 2026 update, the 2026-27 event was expected to keep strengthening through the end of 2026, with a strong to very strong El Niño likely through January to March 2027. Outlooks can change. The book Discover El Niño follows both events month by month.
Questions
How strong was the 2015-16 El Niño?
It peaked at about +2.6°C on NOAA's traditional Oceanic Niño Index, the highest since 1950, and about +2.3°C on the relative index NOAA now uses, level with 1997-98.
Did the 2015-16 El Niño cause the 2016 coral bleaching?
It was a major driver. El Niño added heat on top of long-term ocean warming, and the Great Barrier Reef bleached in early 2016 as part of the third global bleaching event (2014-2017).
Why did California stay dry in 2015-16 despite El Niño?
A NOAA-led study found the dry southern California winter was mostly due to random weather variability. El Niño raised the odds of a wet winter, but did not guarantee one.
Was 2016 the hottest year on record?
It was at the time. 2016 set a global record that was not clearly beaten until 2023 and then 2024.