At a glance
How La Niña works
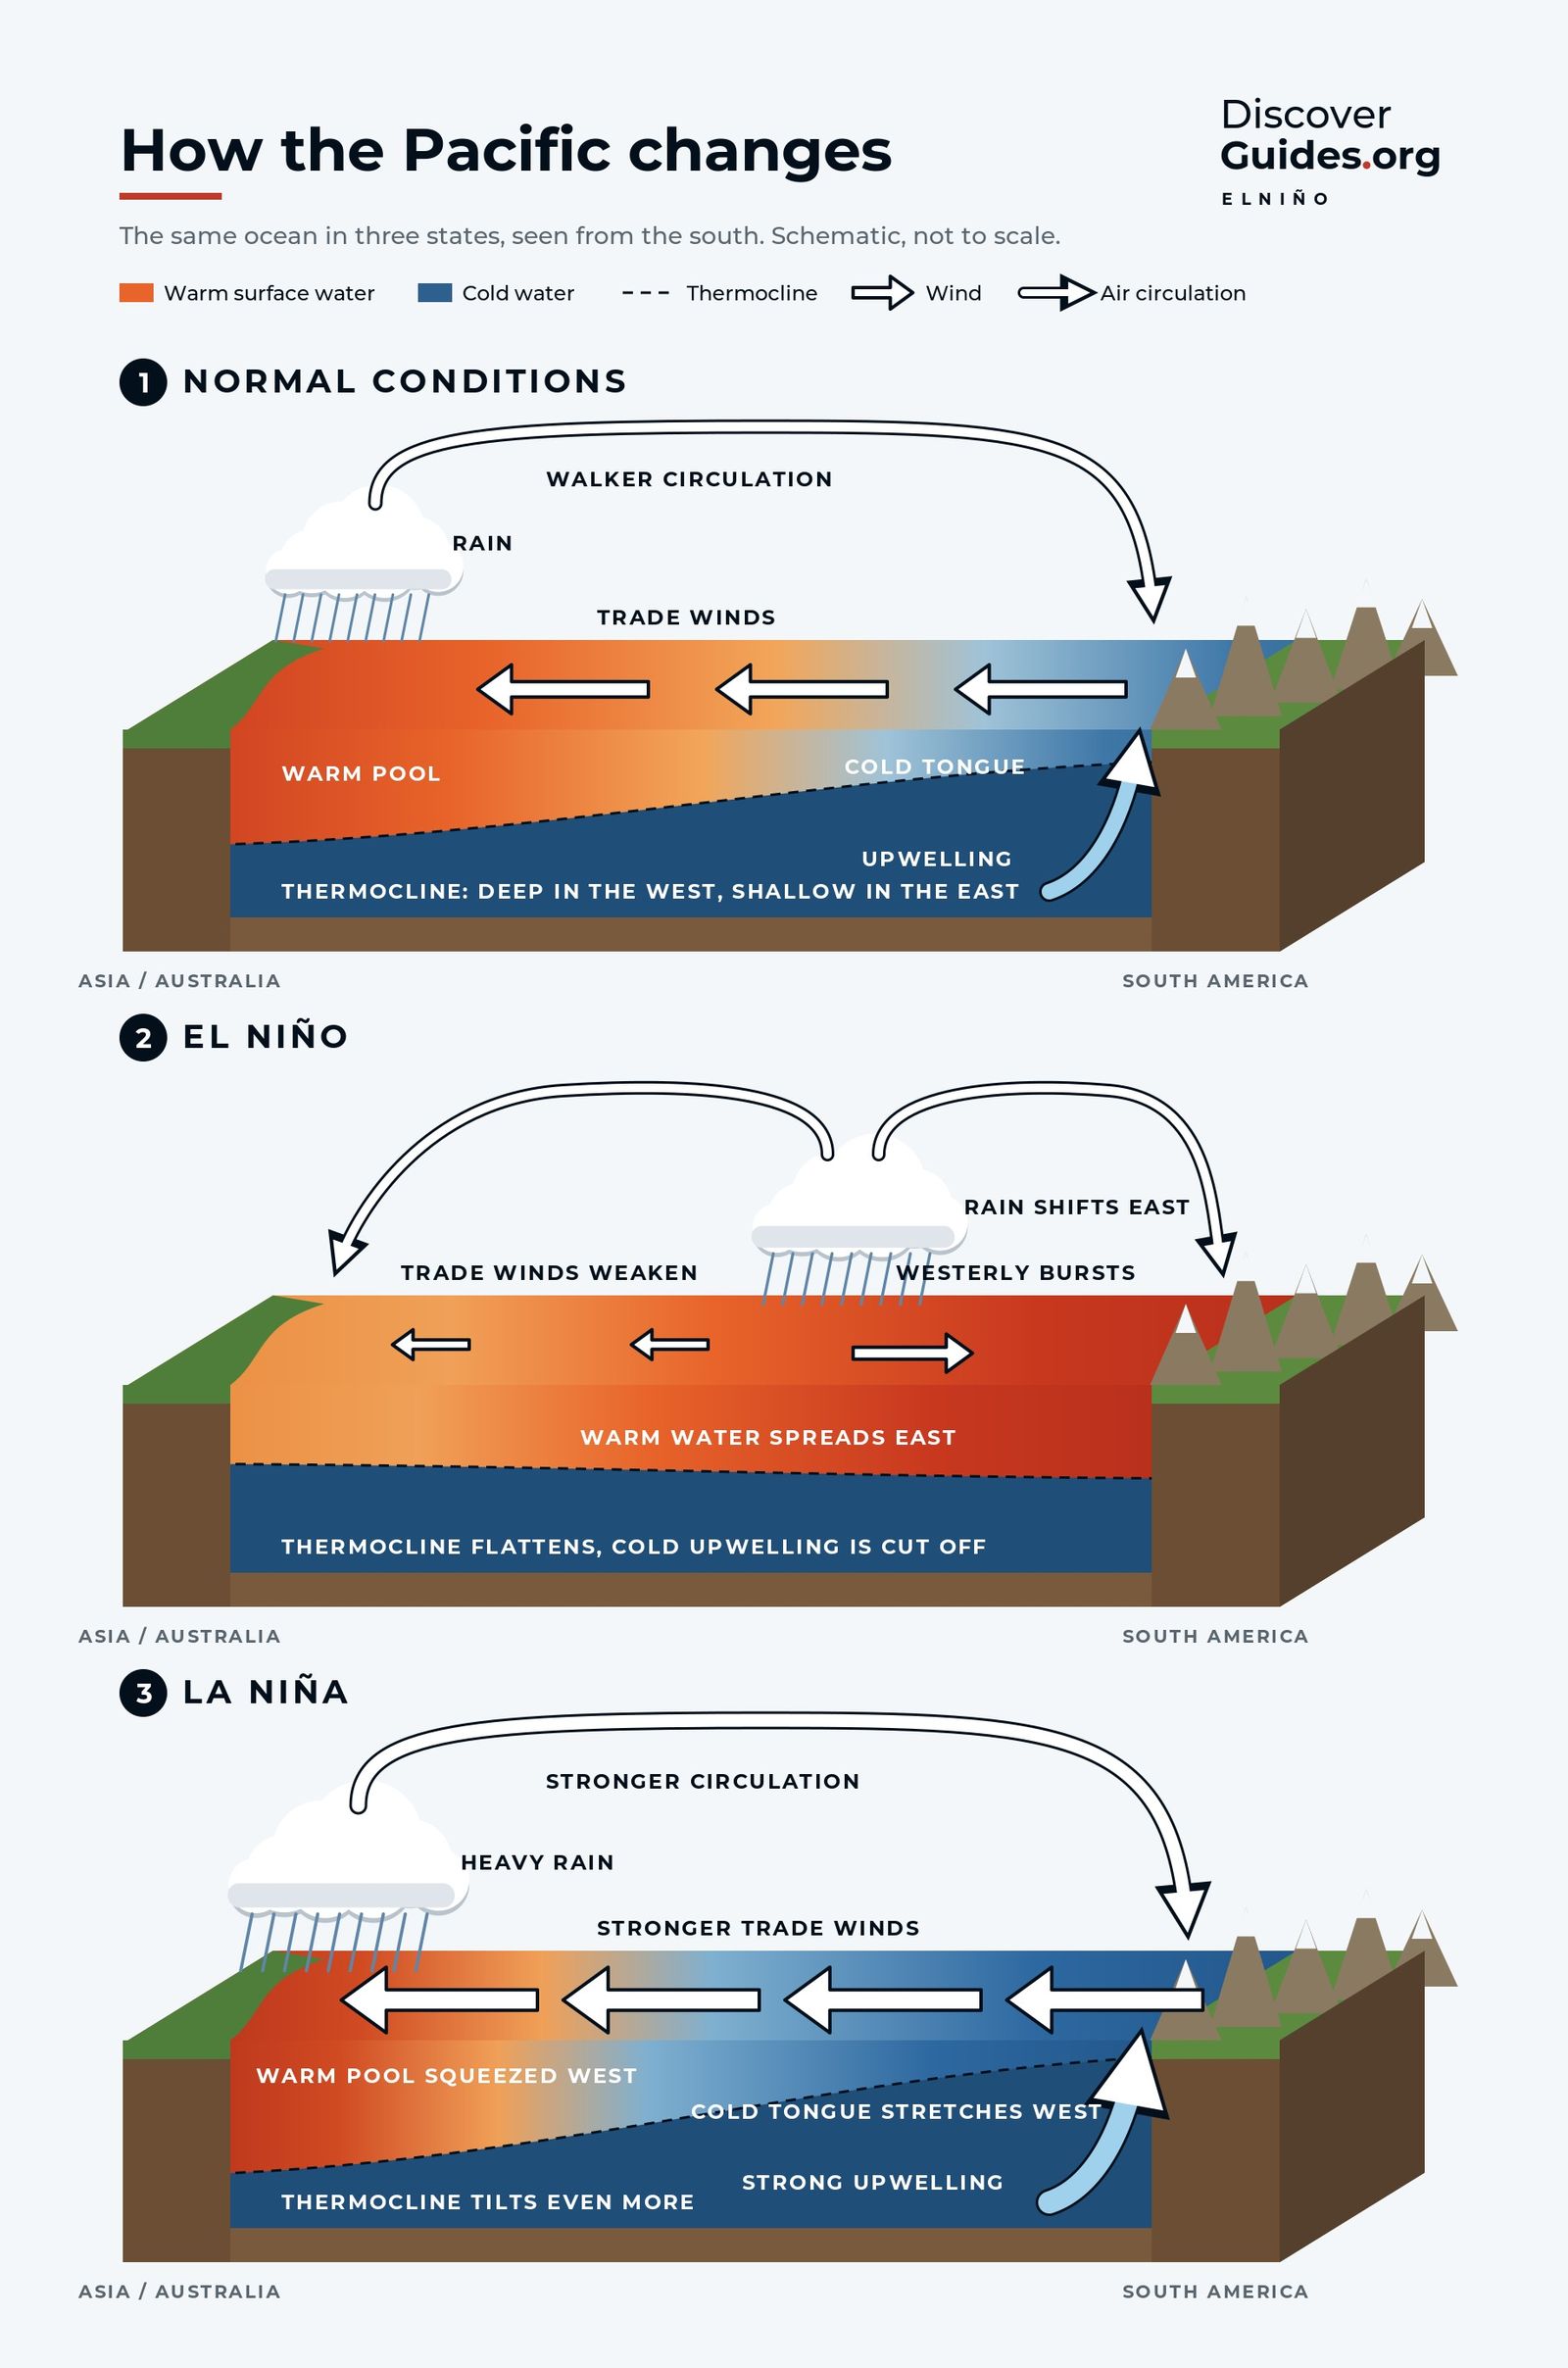
In La Niña the trade winds blow harder than usual. They push even more warm surface water towards Asia, the warm pool shrinks westward, and in the east stronger winds drive stronger upwelling, so the cold tongue along the equator grows colder and stretches further west. NOAA's Climate.gov describes the Walker circulation during La Niña as "turned up to 11" (see The Walker Circulation).
NOAA counts La Niña conditions when Niño 3.4 runs at least 0.5 °C below normal, the atmosphere responds, and, for the record, the chill lasts at least five overlapping three-month seasons. The name, Spanish for "the little girl", was coined in the mid-1980s; before that scientists spoke of an anti-El Niño or El Viejo, "the old man".
The cold giants since 1950
| Event | Lowest 3-month ONI | Season of minimum |
|---|---|---|
| 1973-76 | −2.0 °C | Nov-Jan 1973-74 |
| 1988-89 | −1.8 °C | Oct-Dec and Nov-Jan 1988-89 |
| 2007-08 | −1.8 °C | Dec-Feb 2007-08 |
| 2010-11 | −1.6 °C | Oct-Dec 2010 |
| 1954-56 | −1.6 °C | Oct-Dec 1955 |
| 1998-2001 | −1.5 °C | Winters of 1998-99 and 1999-2000 |
| 2020-23 | −1.1 °C | Oct-Dec and Nov-Jan 2020-21 |
Source: NOAA CPC, Oceanic Niño Index (ERSST v6), accessed November 2026. On NOAA's newer relative index (RONI), the lowest values on record are −1.9 °C, in 1973 and 1988.
1988-89
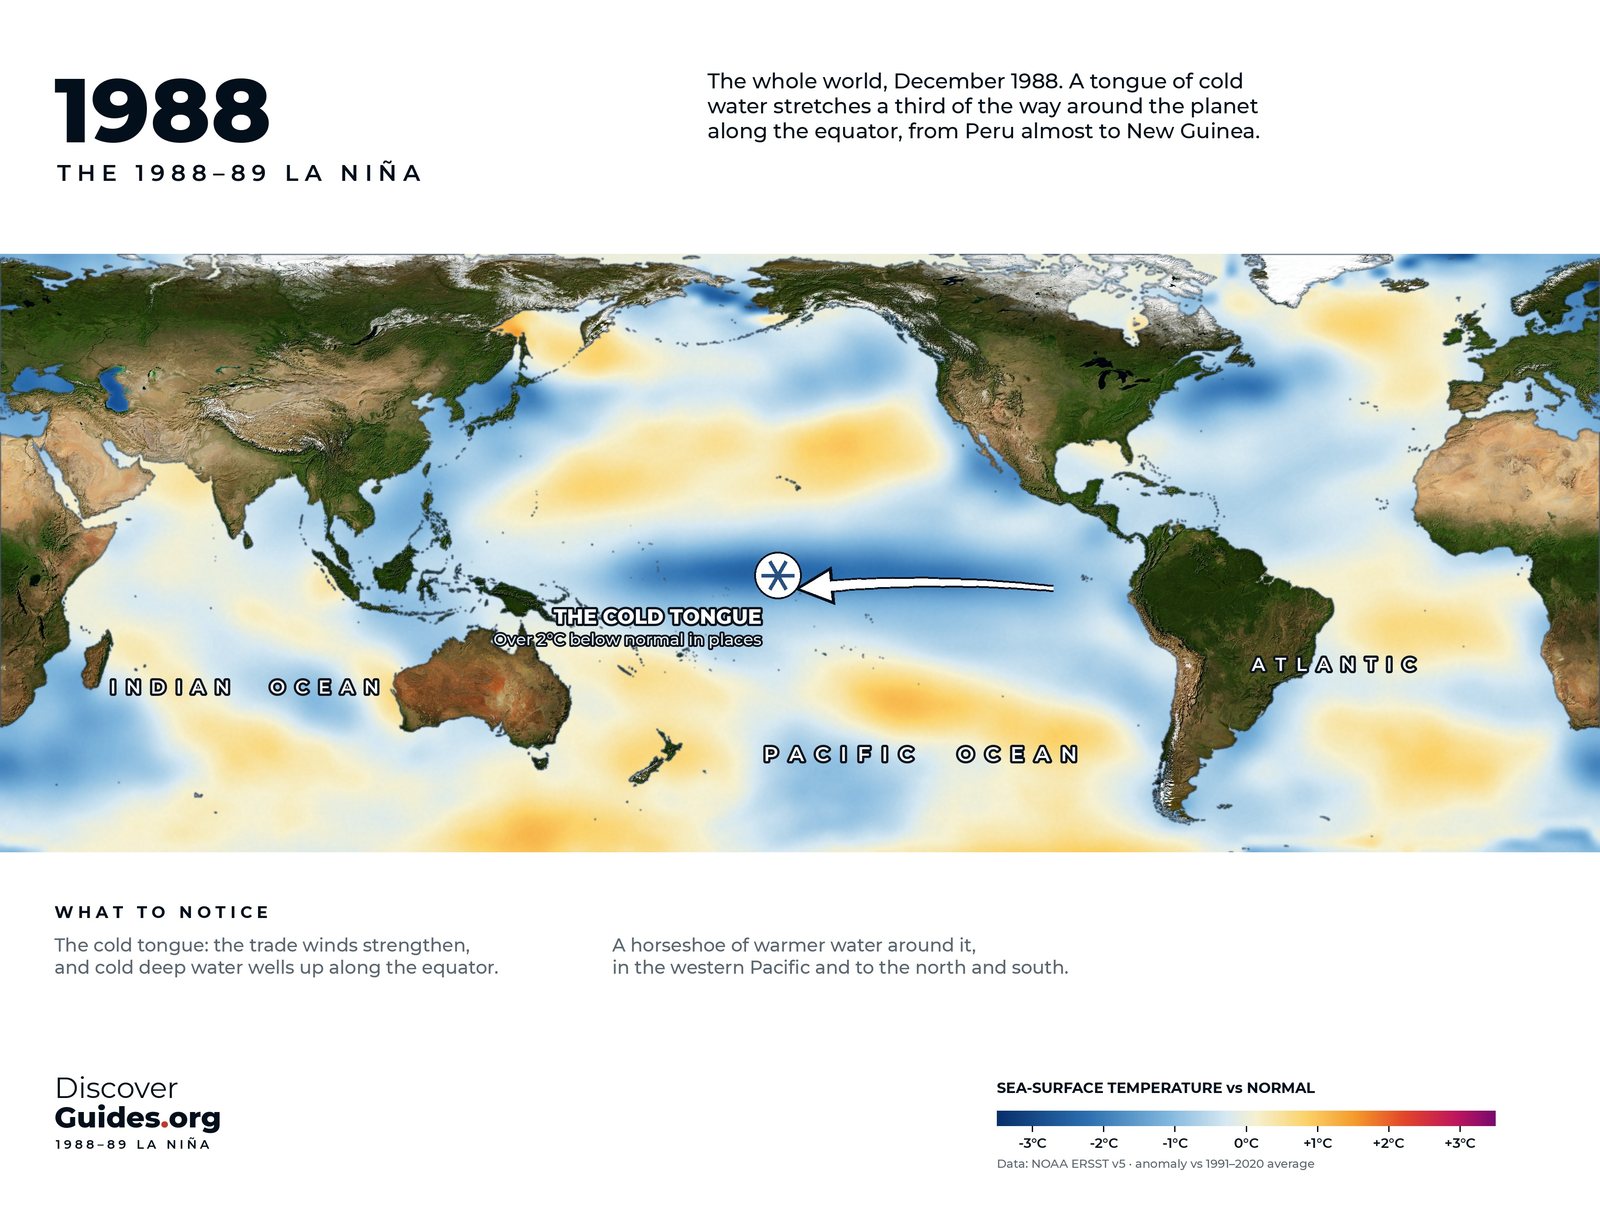
The map at the top shows the Pacific at the height of the 1988-89 La Niña. NOAA's Pacific Marine Environmental Laboratory notes that equatorial sea surface temperatures can fall as much as 4 °C (7 °F) below normal, as they did in this event. Off Peru, upwelling strengthened and coastal waters turned colder and richer in nutrients, good news for the anchoveta and the seabirds.
1988-89 also illustrates La Niña's lagged effects. A 2024 Met Office study led by Professor Adam Scaife found that winters in which El Niño was followed by La Niña, such as 1988-89, 1998-99 and 2007-08, were mild and stormy in the UK.
Why La Niña lingers
La Niña is not simply El Niño with the sign flipped. Its cold is centred further west, and its extremes are smaller: cold anomalies in the strongest La Niñas have topped out at about −2.25 °C, while warm anomalies in the strongest El Niños have reached 2.25-2.75 °C.
The bigger difference is persistence. NOAA's Climate.gov counted twelve first-year La Niñas on record: eight were followed by La Niña again the next winter, two by neutral conditions and only two by El Niño. A leading explanation is about heat: a mature El Niño drives a strong discharge of warm water away from the equator, which shuts it down, while La Niña's weaker coupling produces a weaker discharge. That is how triple dips happen (see The Triple-Dip La Niña of 2020-23).
The record breaker by rainfall: 2010-11
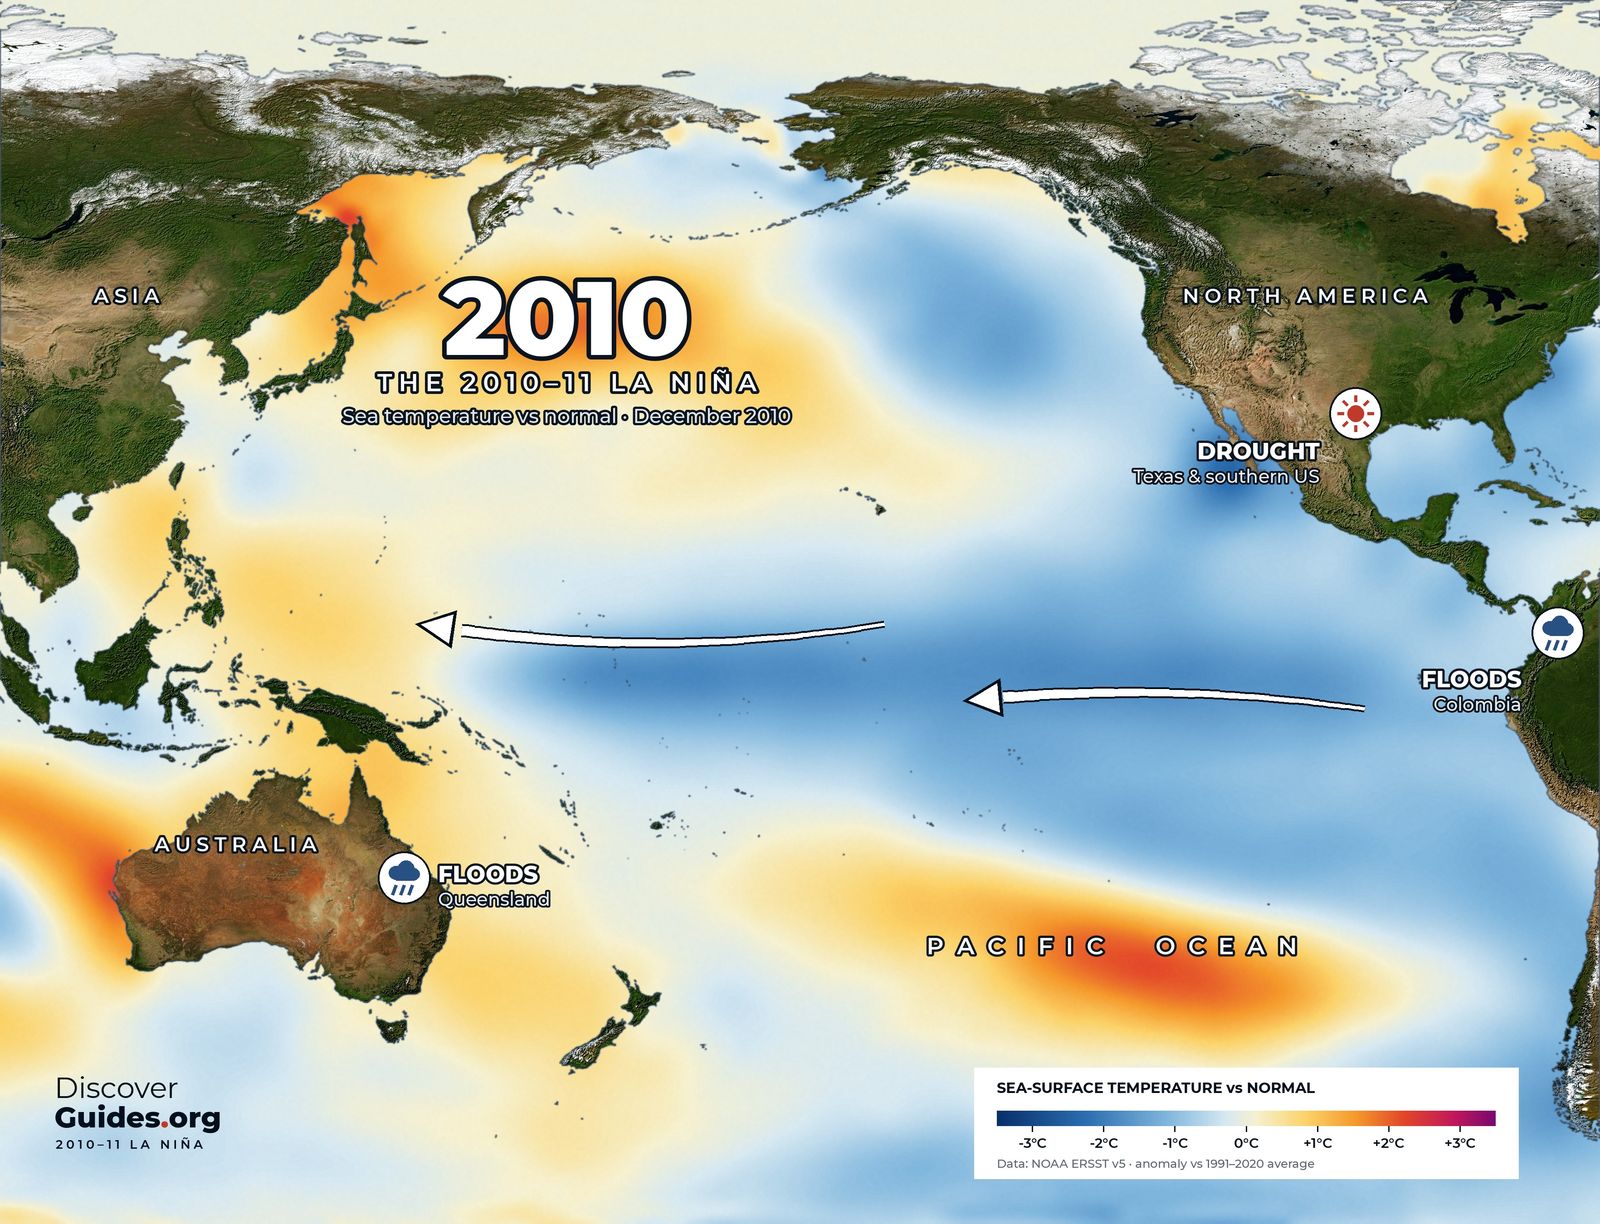
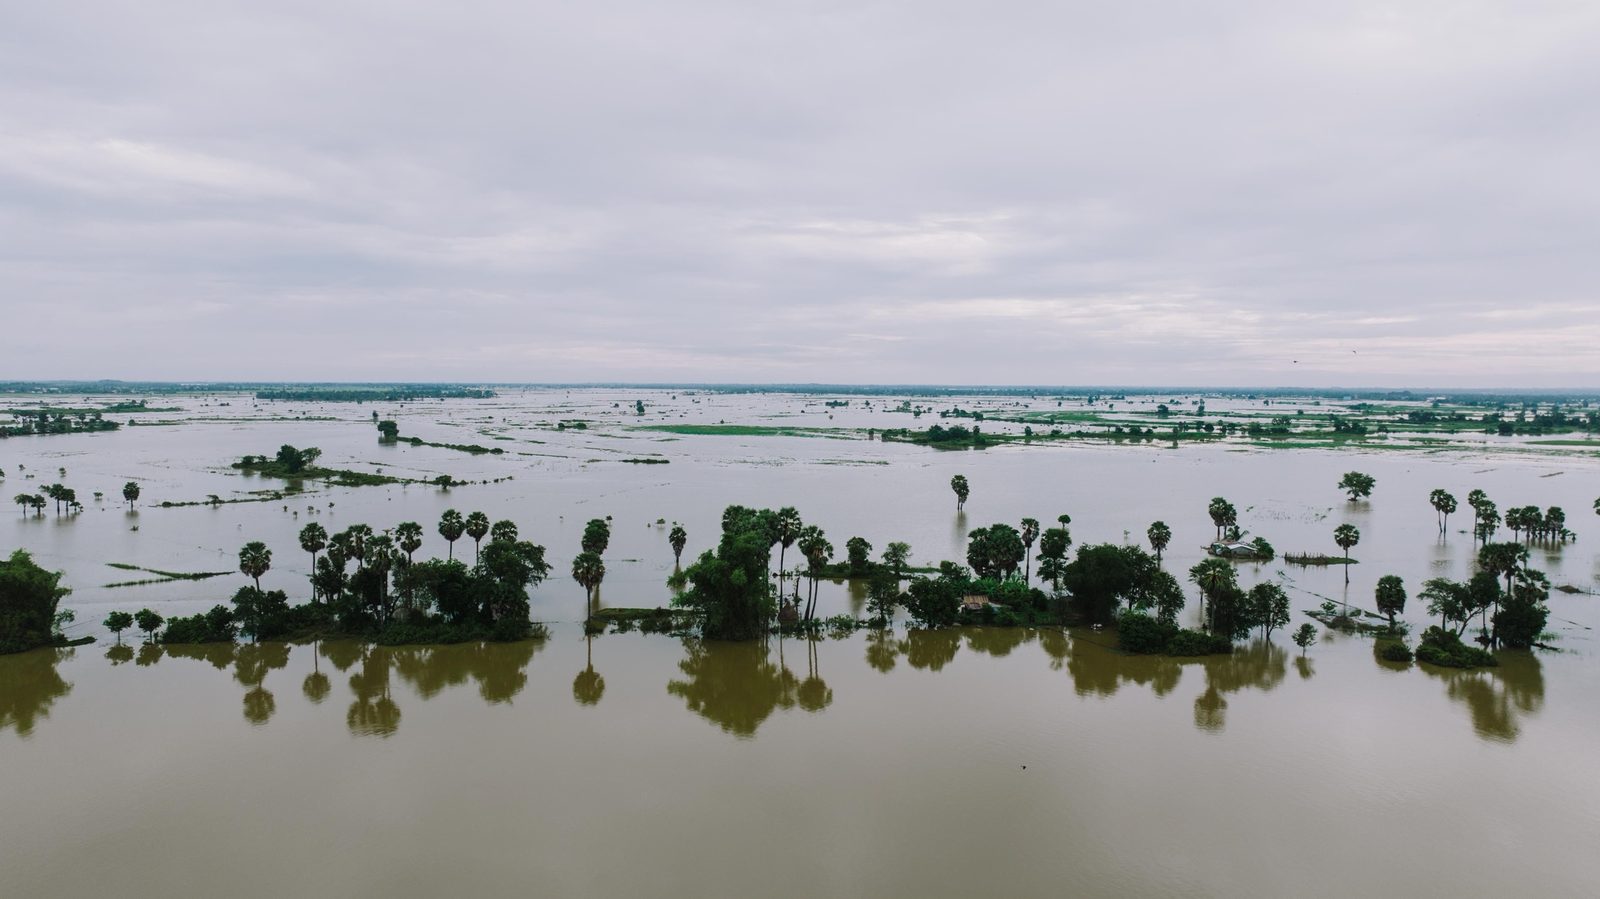
By the Southern Oscillation Index, the La Niña of 2010-11 broke records: +27.1 in December 2010, the highest December value on record. April 2010 to March 2012 was Australia's wettest 24-month period on record, and so much water fell on land that global sea level dropped by about 5 mm. The full story is in El Niño vs La Niña.
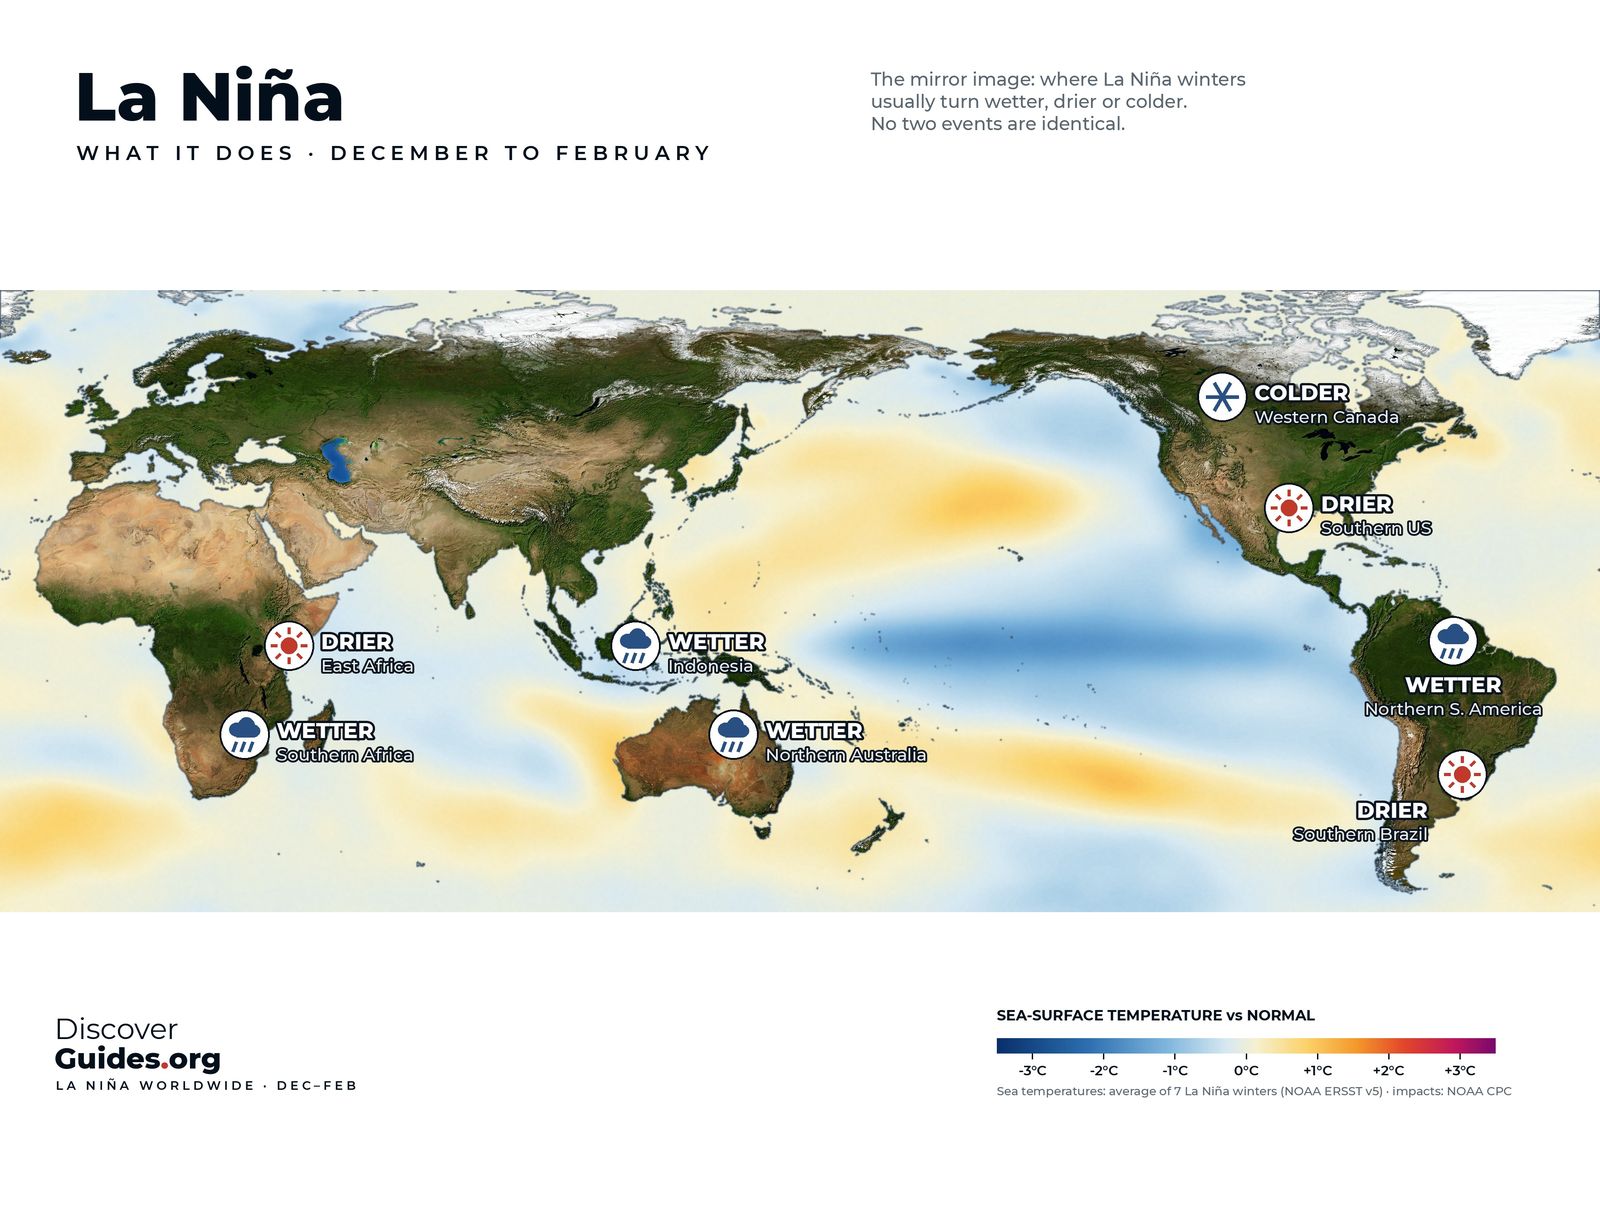
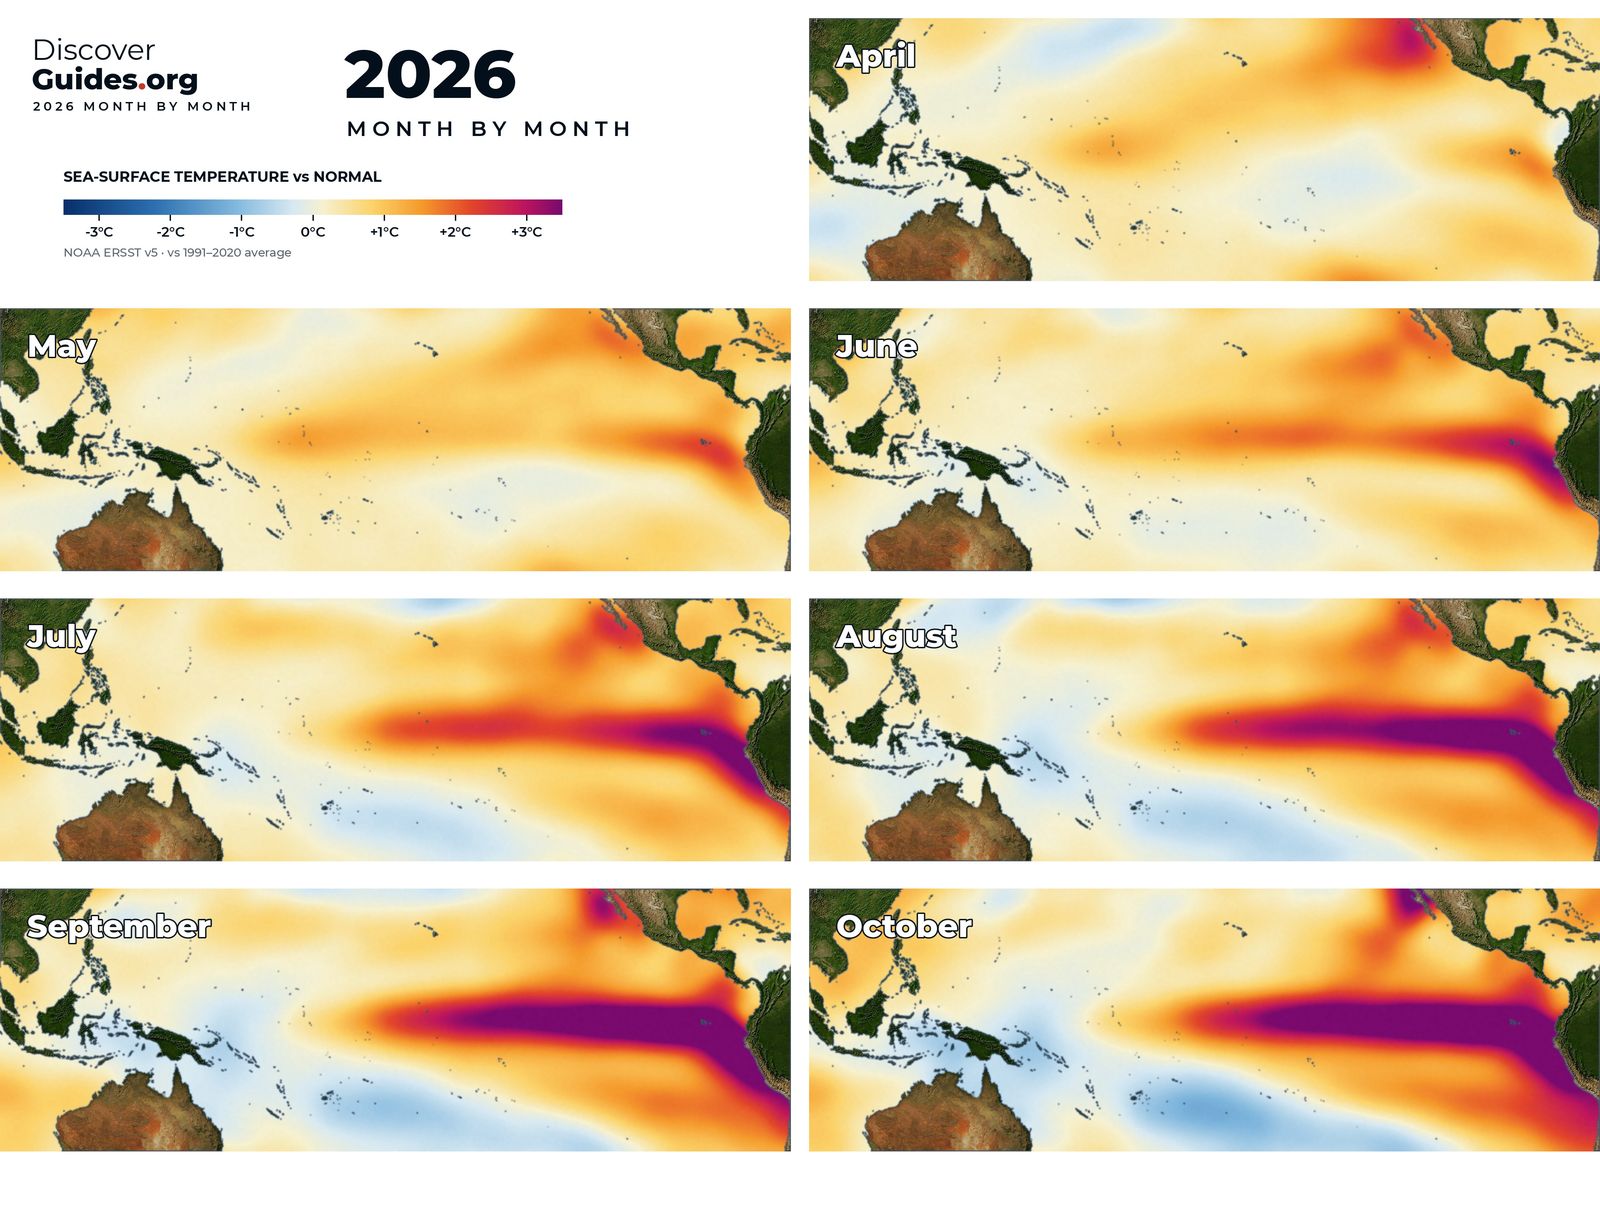
La Niña also reloads the Pacific. While her surface waters are cold, her strong trade winds pile warm water deep in the west, which can set up the next El Niño. The weak La Niña of 2025-26 did exactly that before the 2026-27 giant (see The 2026-27 Super El Niño).
Questions
What was the strongest La Niña on record?
On NOAA's Oceanic Niño Index, the 1973-76 event reached −2.0 °C, followed by 1988-89 and 2007-08 at −1.8 °C. On the newer relative index, 1973 and 1988 share the lowest value, −1.9 °C.
How cold did the Pacific get in 1988-89?
NOAA's Pacific Marine Environmental Laboratory notes that equatorial sea surface temperatures fell as much as 4 °C (7 °F) below normal.
Why does La Niña last longer than El Niño?
A mature El Niño discharges its heat away from the equator, which ends it quickly. La Niña's weaker coupling means a weaker discharge, so it often returns for a second or third winter.
How long can La Niña last?
Commonly one to three years. The longest La Niña on NOAA's record lasted 33 months.