At a glance
The four Niño regions
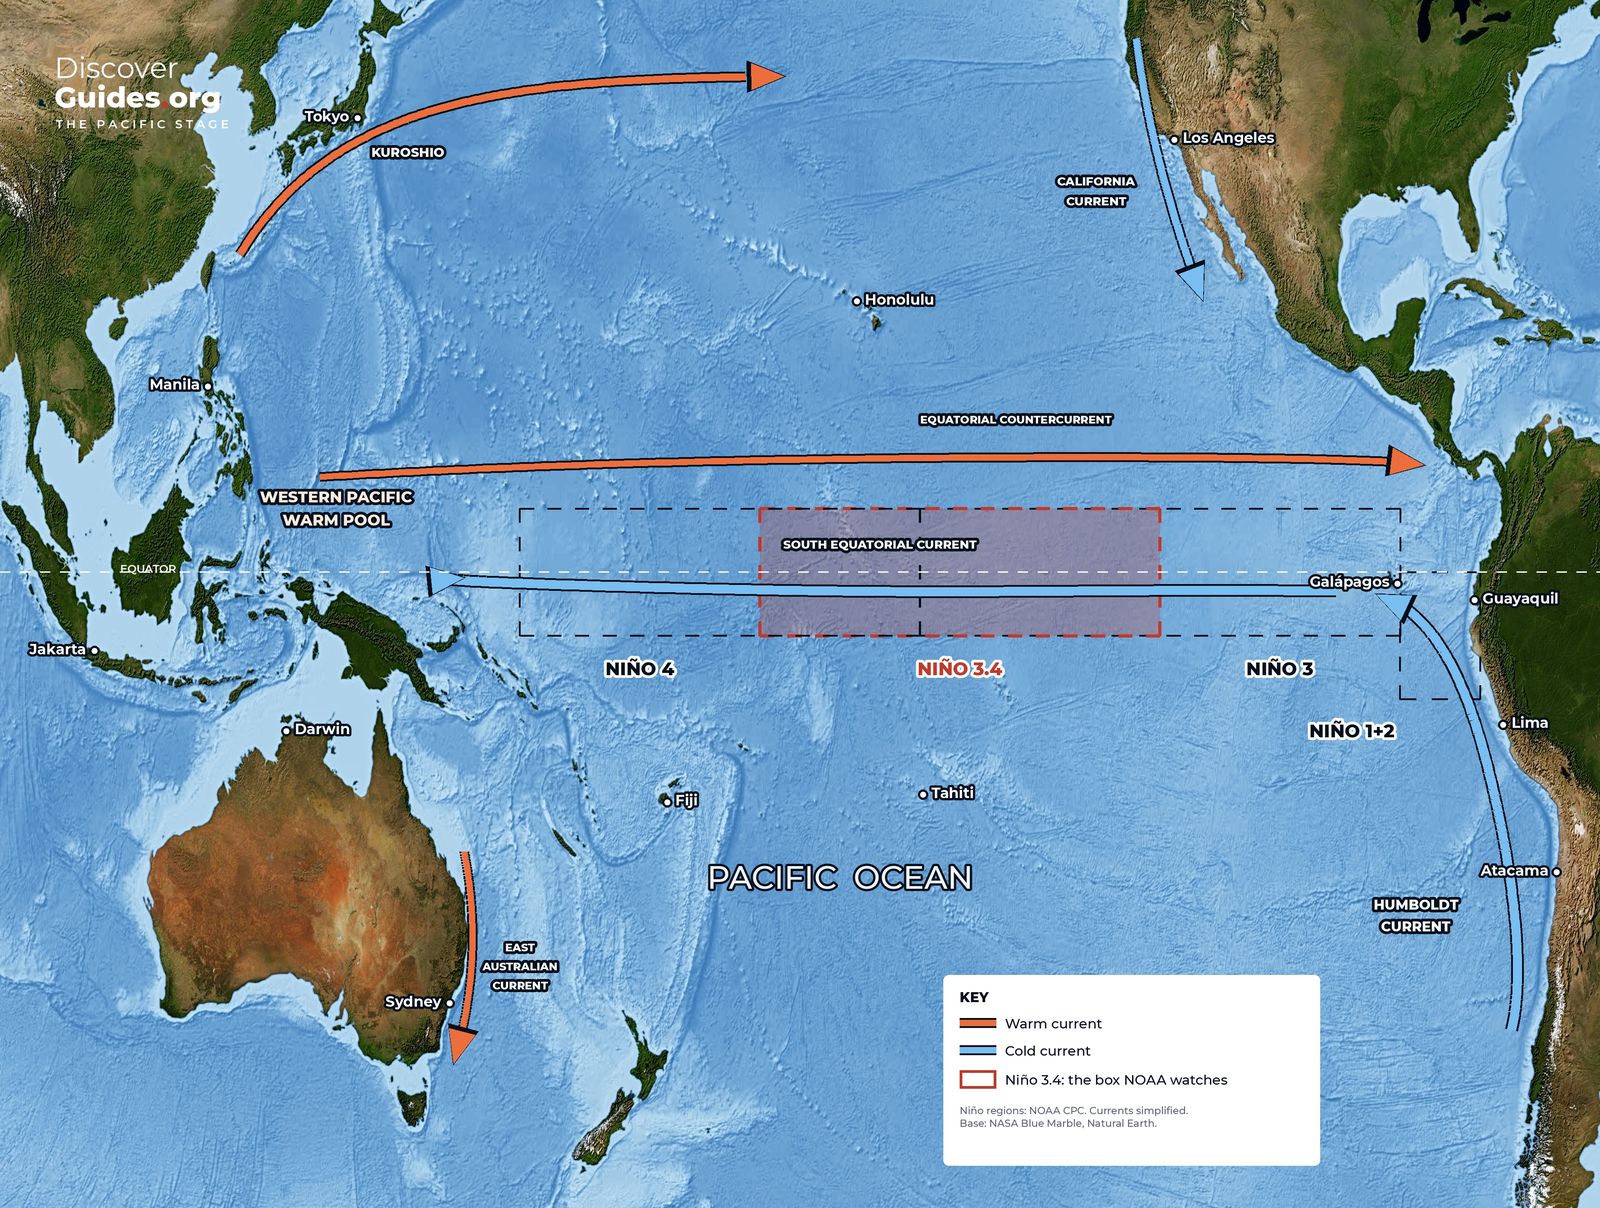
Scientists track El Niño in four boxes strung along the equatorial Pacific. The smallest and easternmost, Niño 1+2, hugs the coast of Peru and Ecuador, where local people first recognised the phenomenon; its temperatures swing more widely than any other region. Niño 4 sits in the central Pacific around the date line. Between them lie Niño 3 and the overlapping Niño 3.4, the region used for official monitoring.
| Region | Latitude | Longitude | What it captures |
|---|---|---|---|
| Niño 1+2 | 0°-10° S | 90° W-80° W | Coastal warming off Peru and Ecuador |
| Niño 3 | 5° N-5° S | 150° W-90° W | The eastern equatorial Pacific |
| Niño 3.4 | 5° N-5° S | 170° W-120° W | East-central Pacific; the official ENSO index |
| Niño 4 | 5° N-5° S | 160° E-150° W | The central Pacific around the date line |
The Oceanic Niño Index (ONI)
For decades NOAA's headline measure has been the Oceanic Niño Index: the average sea-surface temperature anomaly in Niño 3.4 over three consecutive months. An El Niño is declared when that average reaches +0.5 °C, and an episode enters the history books once the threshold has held for at least five overlapping three-month seasons. La Niña mirrors it at −0.5 °C.
Other agencies set the bar differently. Australia's Bureau of Meteorology typically declares El Niño when Niño 3.4 runs more than 0.8 °C above average and its Southern Oscillation Index falls below −8 (see Tahiti, Darwin and the See-Saw of the Pacific). The two systems usually agree on the big events but can disagree on borderline ones.
Why NOAA switched to RONI
The whole tropical ocean is warming. Measure Niño 3.4 against a past average and a warming background can masquerade as El Niño. On 1 February 2026 NOAA's Climate Prediction Center switched its official monitoring and forecasts to the Relative Oceanic Niño Index (RONI). It subtracts the average anomaly of the whole tropical belt, from 20° south to 20° north, from the Niño 3.4 anomaly, then rescales the result. It asks a simpler question: is the central-eastern Pacific warmer or cooler than the rest of the tropics? The ±0.5 °C thresholds stay the same.
- Lost: the weak El Niño winters of 1958-59, 2014-15 and 2019-20 no longer qualify.
- Gained: 1992-93 now counts as a weak El Niño winter.
- Shrunk: 2023-24 falls from about +2 °C on the old index to +1.4 °C on RONI.
- Unchanged: NOAA stresses that 2023-24's real-world impacts were the same; only the yardstick moved.
Weak, moderate, strong, very strong
Most scientists grade events by their peak anomaly: weak from 0.5 to 0.9 °C, moderate from 1.0 to 1.4 °C, strong from 1.5 to 2.0 °C and very strong above 2.0 °C. "Super El Niño" is not an official category; it is the popular name for the very strong class. In its October 2026 discussion, NOAA set a three-month RONI of +2.5 °C or more as the mark of a historic event.
| Event | Peak ONI (°C) | Peak RONI (°C) |
|---|---|---|
| 1972-73 | +1.8 | +2.0 |
| 1982-83 | +2.1 | +2.4 |
| 1997-98 | +2.4 | +2.3 |
| 2015-16 | +2.6 | +2.3 |
| 2023-24 | +2.0 | +1.4 |
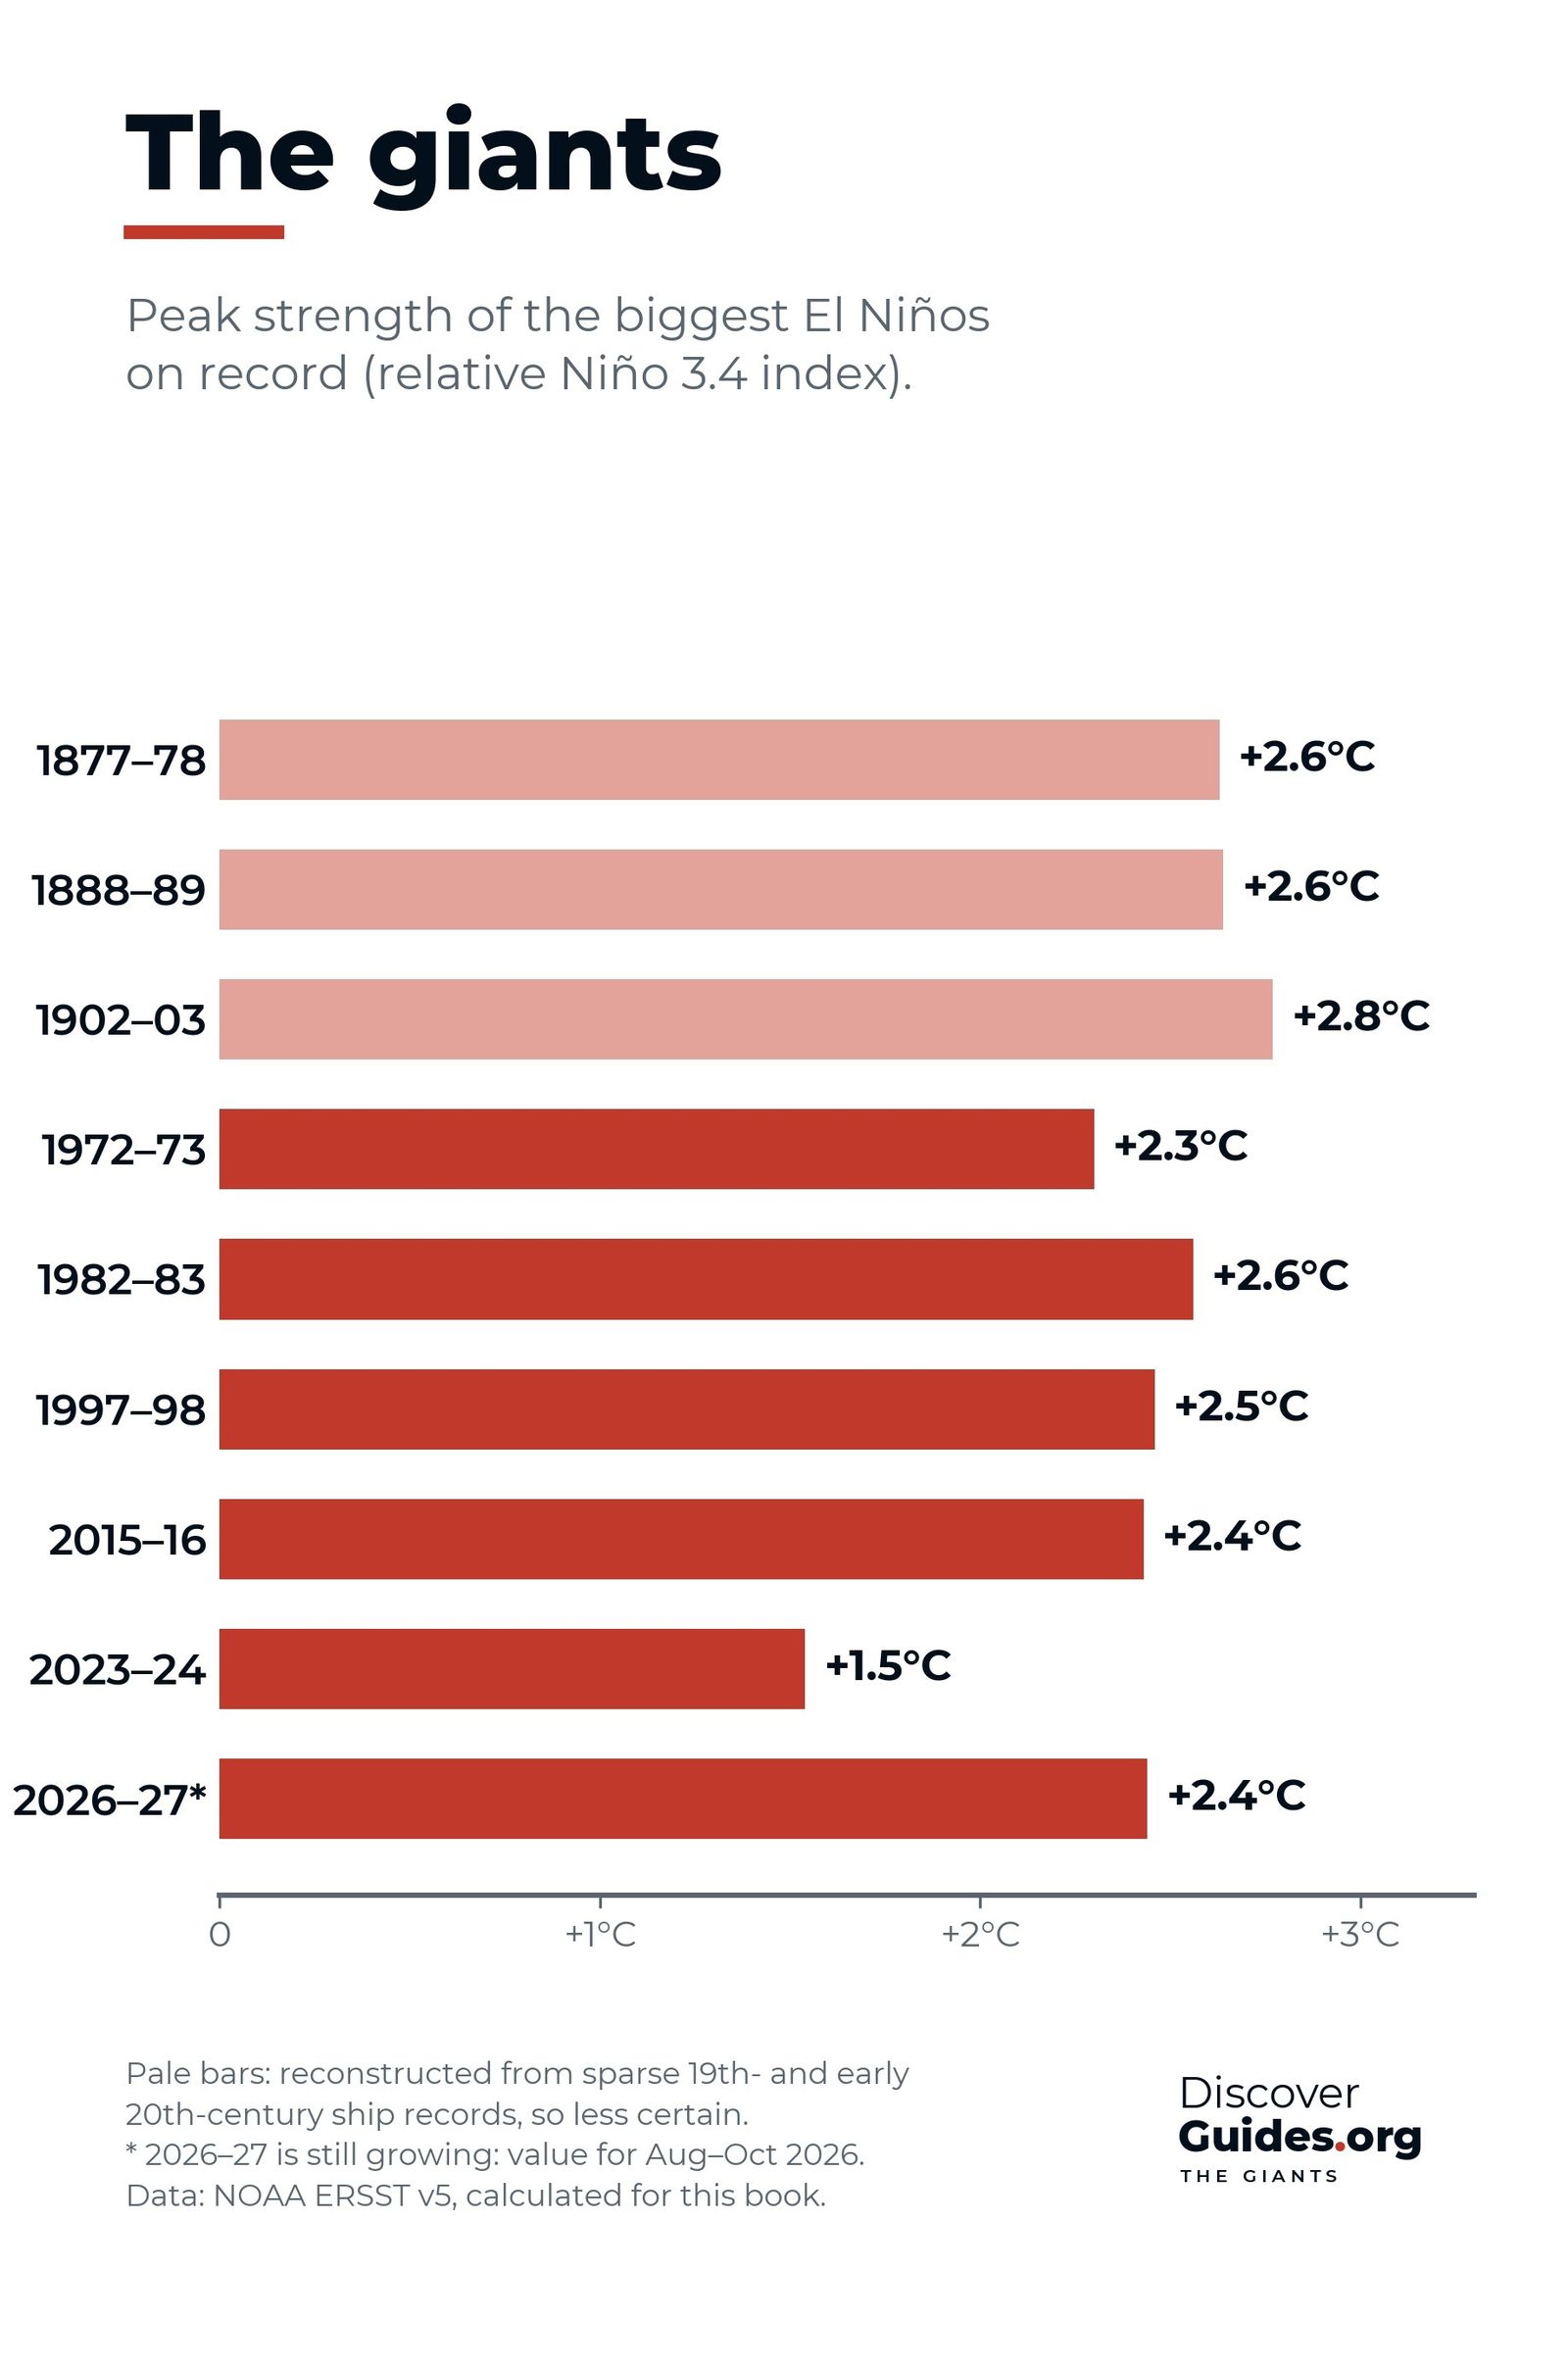
Which giant is biggest depends on the yardstick: on the ONI, 2015-16 leads; on RONI, 1982-83 edges ahead. The chart at the top of this page, computed by the book from NOAA's ERSST data, adds the giants of the 1870s and 1880s (see also The Strongest El Niños in History).

Why the numbers do not always match
Agencies measure the same ocean in different ways. Columbia University's IRI, using the traditional measure, reported a September 2026 Niño 3.4 anomaly of +2.84 °C, while NOAA's relative figure for that month was +2.1 °C and the Bureau of Meteorology's relative weekly index reached +2.88 °C in late October. None of these is wrong; compare like with like. NOAA's alert system and where to find each agency's numbers are in El Niño Forecasts Explained.
Questions
What is Niño 3.4?
Niño 3.4 is a box of the equatorial Pacific from 5°N to 5°S and 170°W to 120°W. Its sea surface temperature anomaly is the main index used to declare El Niño and La Niña.
What is the ONI?
The Oceanic Niño Index is the three-month average sea surface temperature anomaly in the Niño 3.4 region. El Niño conditions start at +0.5 °C and La Niña at −0.5 °C.
What is RONI?
The Relative Oceanic Niño Index, NOAA's official measure since 1 February 2026. It compares Niño 3.4 with the average of the whole tropical belt, so the long-term warming of the oceans is not mistaken for El Niño.
What counts as a super El Niño?
It is not an official term. It usually means a very strong event, with a peak anomaly above +2.0 °C. NOAA now calls a three-month RONI of +2.5 °C or more historic.