At a glance
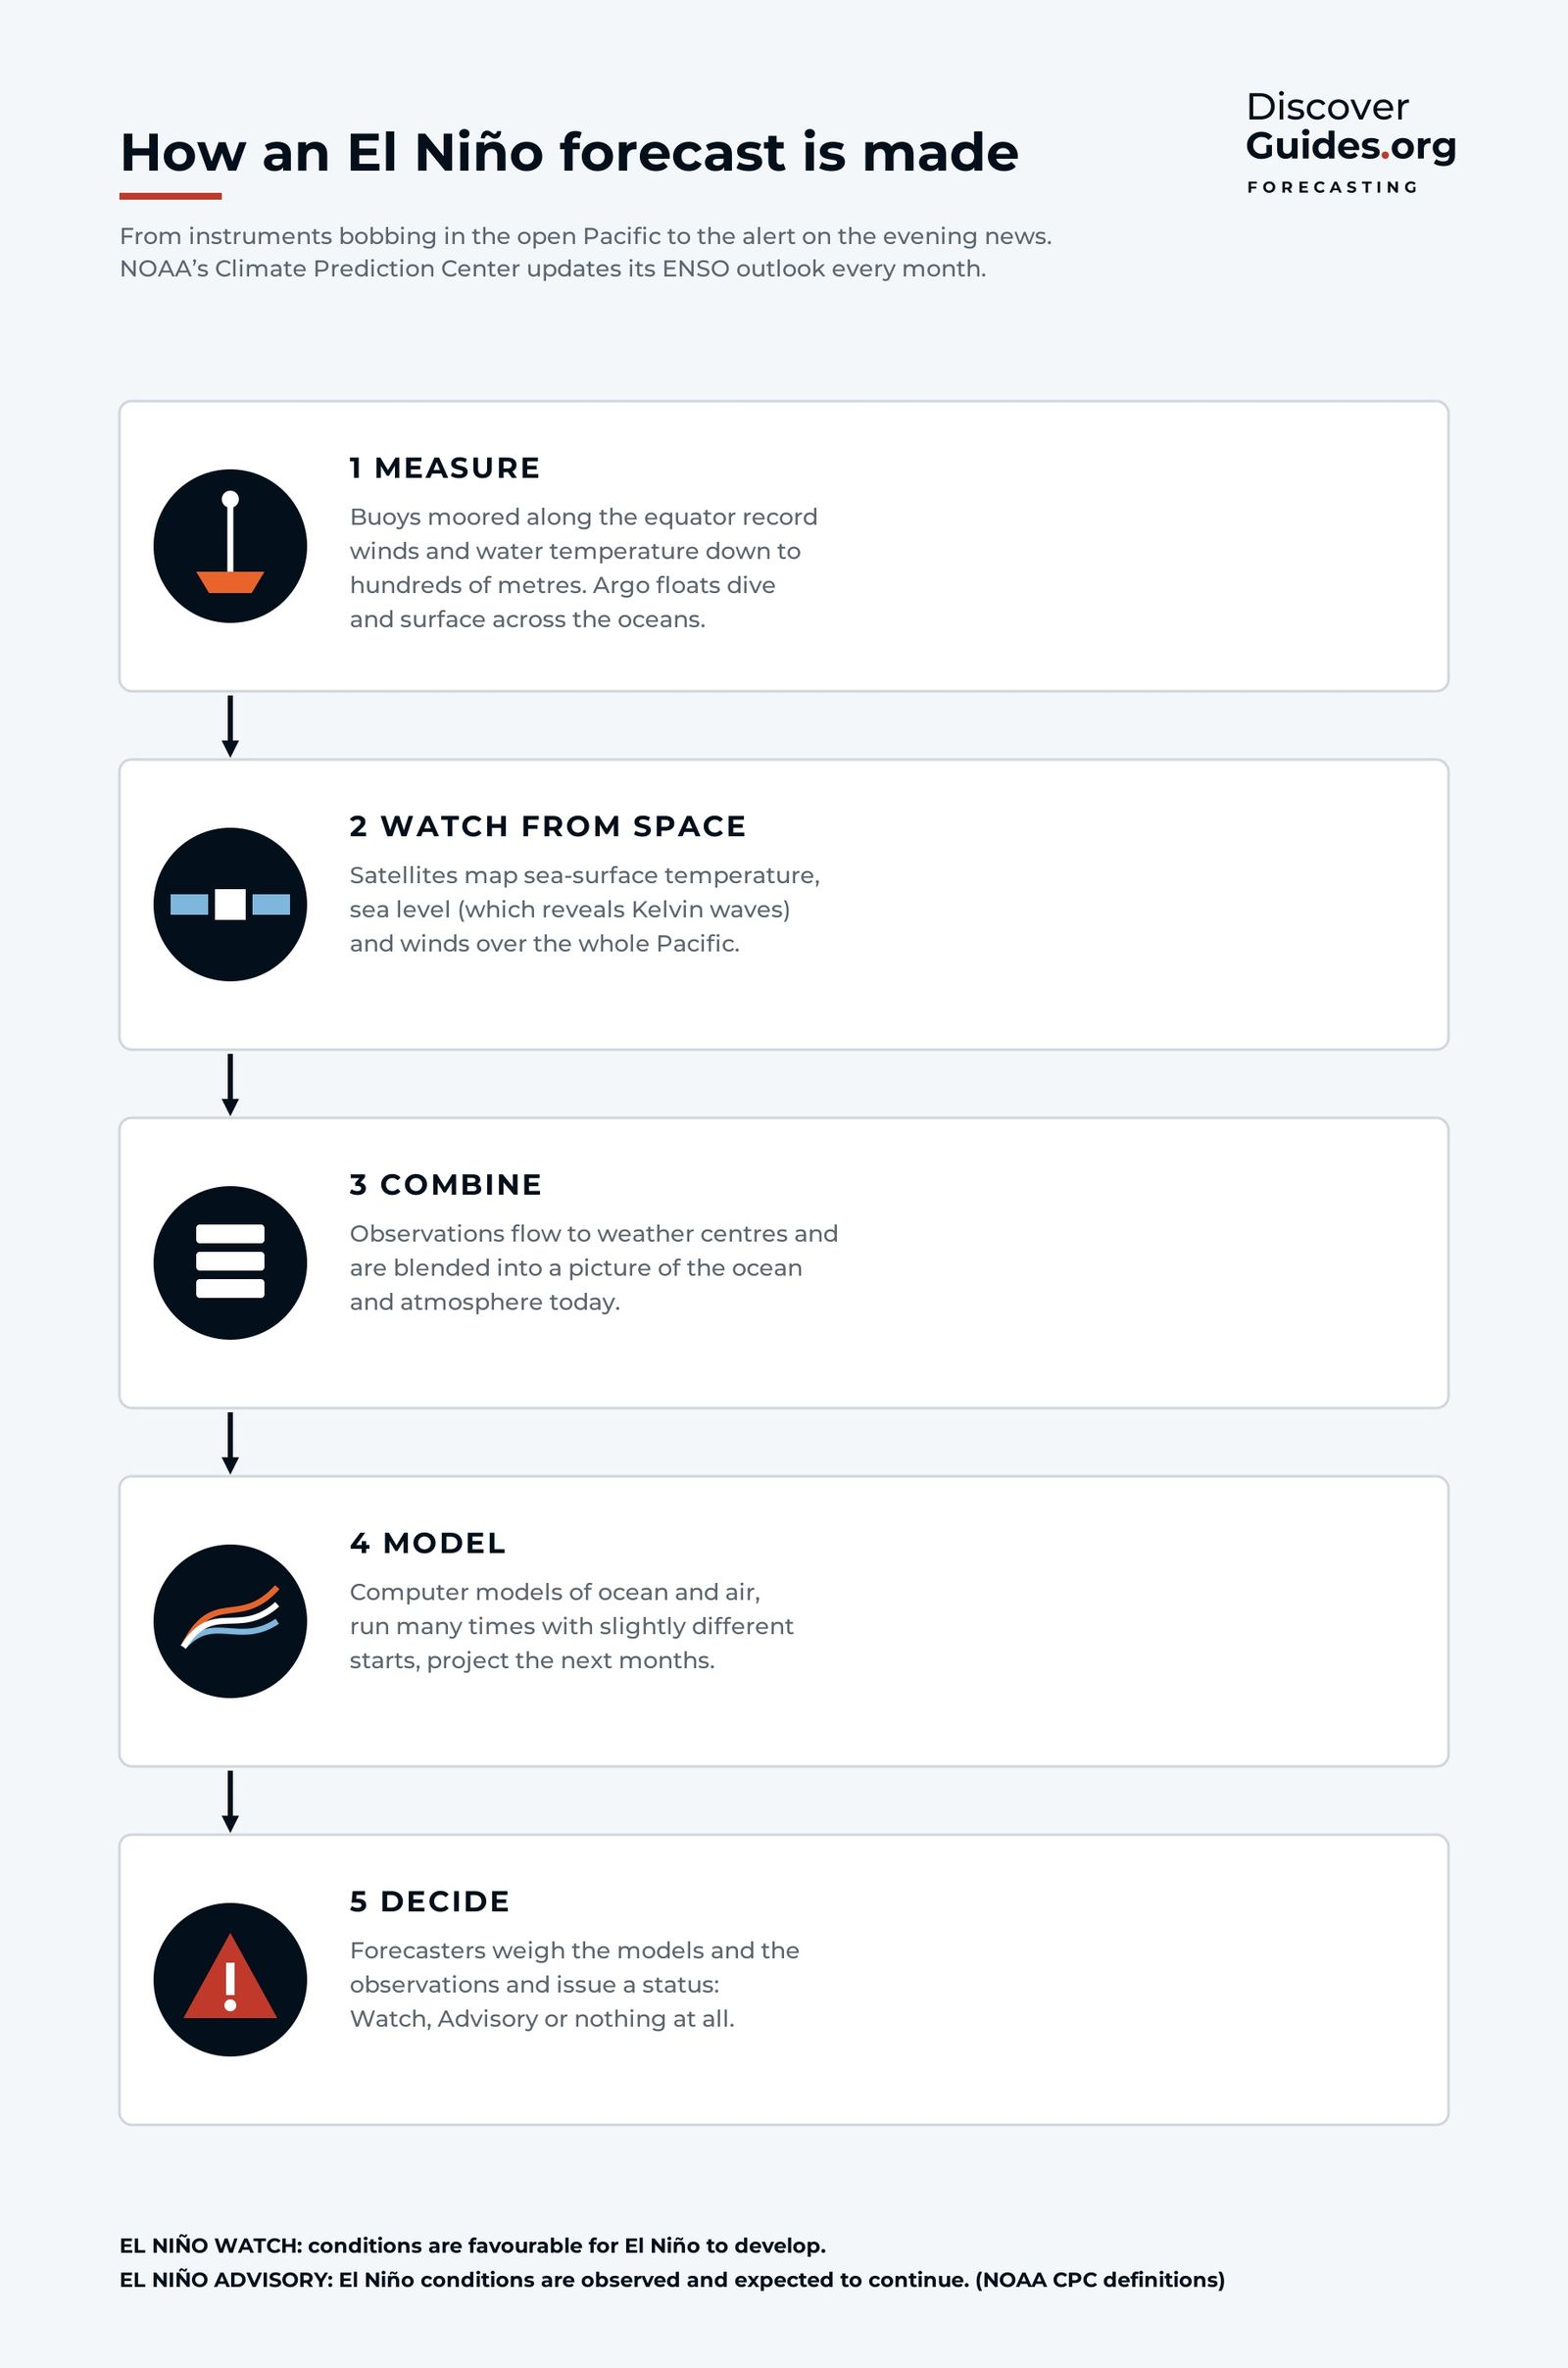
In 1982 one of the strongest El Niños of the century was well under way before scientists realised what was happening. Today the tropical Pacific is one of the most closely watched places on Earth, and El Niño can often be anticipated months in advance. The forecast process has five broad steps, shown at the top of this page.
1-2. Measure the ocean, from below and from space
Along the equatorial Pacific sits a line of moored buoys, the TAO/TRITON array. Its core was completed in 1994, largely in response to the surprise of 1982-83. The buoys record surface winds, air temperature and water temperature down to hundreds of metres, which lets forecasters see warm water building and moving long before it reaches the surface.
Across the open ocean, about 4,000 Argo floats drift at depth, rise to the surface every ten days or so measuring temperature and salinity on the way, and send their data by satellite. Ships, island stations and tide gauges add to the picture.
Watching from space
Satellites map sea-surface temperature across the whole Pacific, measure winds over the ocean, and track sea level to within a few centimetres. Sea level is especially useful: a Kelvin wave, the hidden pulse of warm water that crosses the Pacific before an El Niño, shows up as a travelling bump in the ocean surface. The physics is in How Does an El Niño Start?.
3. Combine and 4. Model
All these observations flow to forecasting centres, where they are blended into a single, consistent picture of the ocean and atmosphere. That starting state then feeds two families of models:
- Dynamical models simulate the physics of ocean and air on a computer, much like a weather model but run months ahead and coupled to a full ocean.
- Statistical models look for patterns in past data that have tended to precede El Niño or La Niña.
Each dynamical model is run many times from slightly different starting points. The spread of those runs, called an ensemble, shows how confident the forecast is. Plotted together, the results of many models form the familiar "plume" chart: lines fanning out from today's value into the coming seasons.
5. Decide: Watches and Advisories
NOAA's Climate Prediction Center, working with forecasters at the International Research Institute for Climate and Society (IRI), weighs the models and observations and issues the ENSO Diagnostic Discussion on the second Thursday of every month. At the top sits a status from the ENSO Alert System:
| Status | What it means (NOAA definition) |
|---|---|
| El Niño Watch | Conditions are favourable for El Niño to develop within the next six months |
| El Niño Advisory | El Niño conditions are observed and expected to continue |
| Final El Niño Advisory | El Niño conditions have ended |
| Not Active | Neither El Niño nor La Niña is observed or expected in the coming six months |
El Niño conditions require the relative Niño-3.4 sea-surface temperature to be at least 0.5°C above normal, with the expectation that it stays there across several overlapping three-month seasons, and with the atmosphere responding. Since early 2026, NOAA has used the relative index (RONI), which compares the Niño-3.4 region with the whole tropical belt.
How to read an ENSO update
The most useful part of the update is the probability table: the chance of El Niño, neutral or La Niña for each overlapping three-month season ahead. A few habits help:
Reading NOAA's monthly ENSO update
- Read the status first: Watch, Advisory or Not Active
- Check the latest Niño-3.4 value against the ±0.5°C threshold
- Read the probability table season by season, not just the headline
- Treat probabilities as odds: 70% means a 3-in-10 chance of something else
- Look for the trend from last month: are the chances rising or falling?
- For impacts where you live, go to your national weather service's seasonal outlook
For example, NOAA's October 2026 update put the chance of a historic El Niño (a three-month relative Niño-3.4 of +2.5°C or more) at 83% for October-December 2026. That is a strong signal, but it still leaves roughly a one-in-six chance that the event falls short of that mark. The current numbers are in The 2026-27 Super El Niño.
The spring barrier
El Niño forecasts are not equally good all year. Forecasts made in the northern spring, from roughly March to May, are noticeably less reliable. This is the spring predictability barrier. In spring the Pacific is in transition, the east-west contrast is at its weakest, and short bursts of wind can tip the system one way or the other.
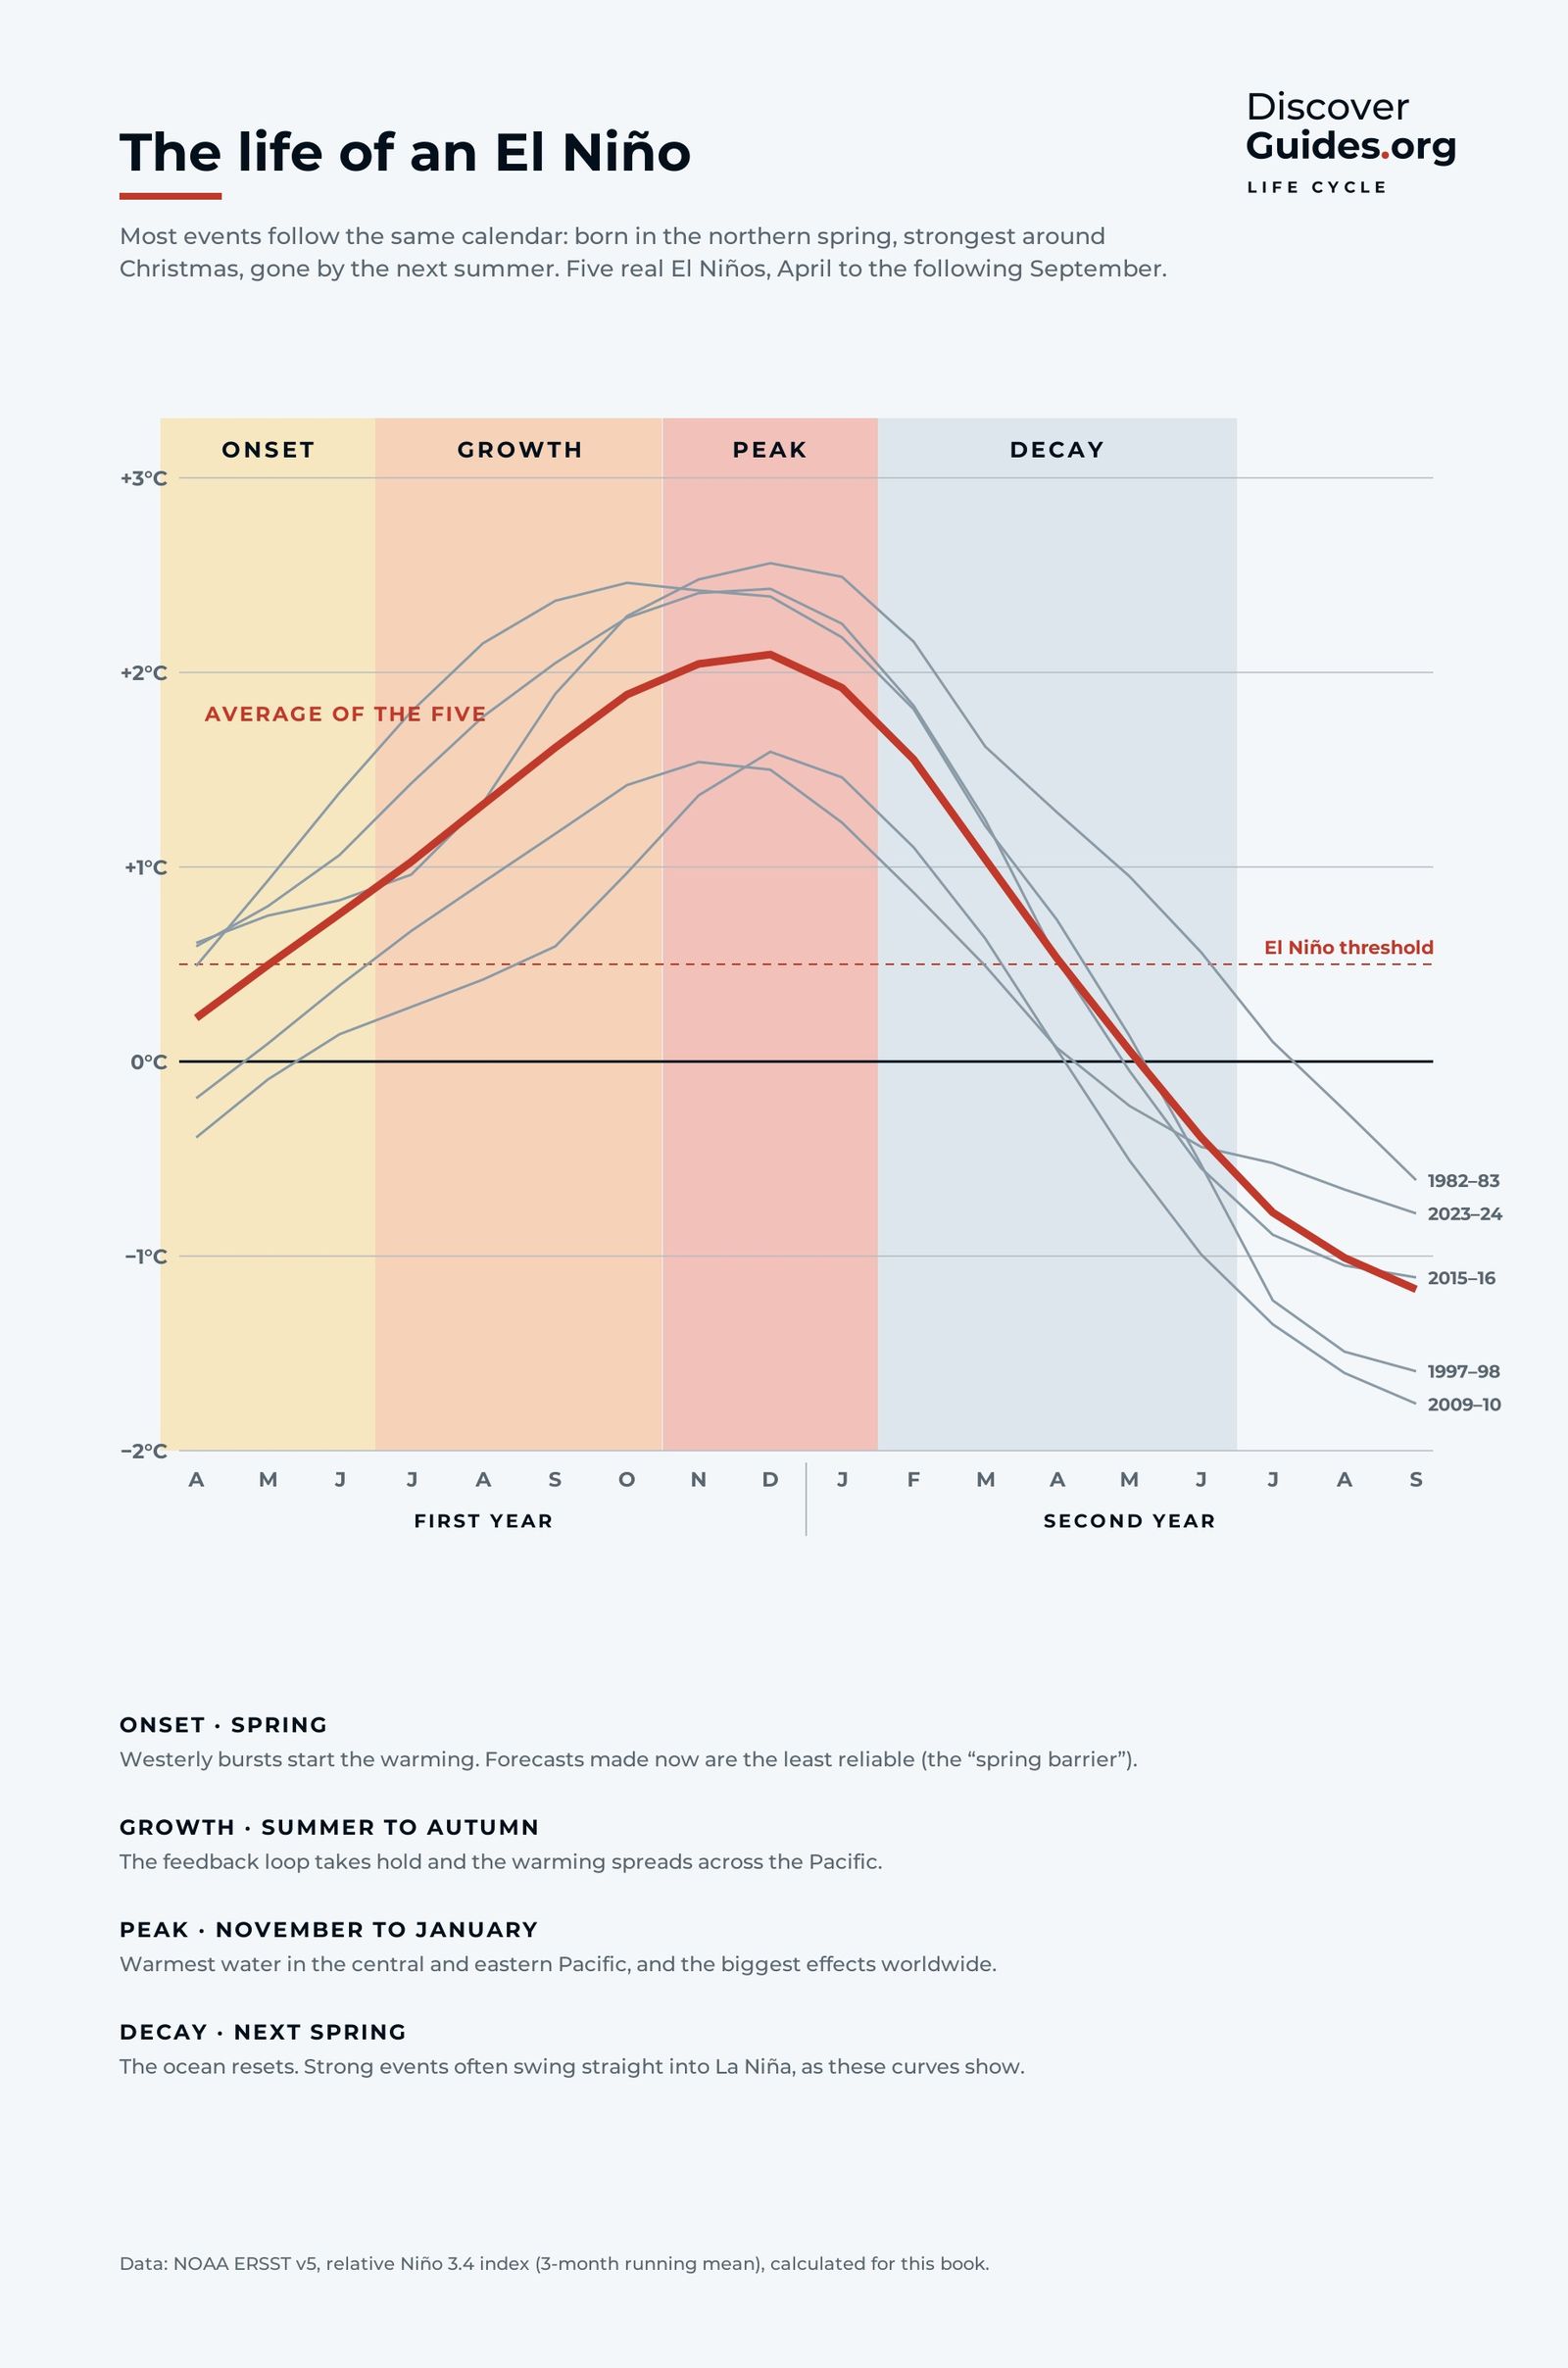
Once an event is established, forecasts improve sharply. By late summer, forecasters can usually say with confidence that an El Niño will last through the winter. Its exact peak strength is harder to pin down, which is why the probabilities keep shifting even when the outlook is clear.
From forecast to impact
An El Niño forecast is a forecast for the ocean. Turning it into a forecast for rain in California or the monsoon in India takes another step, carried out by national weather services in their seasonal outlooks. Those outlooks combine El Niño with other influences, such as the Indian Ocean or long-term warming, and are the right place to look for local guidance. The typical patterns are mapped in What El Niño Means for Weather Around the World.
For live data, read NOAA's ENSO Diagnostic Discussion. The forecasting chapter of Discover El Niño follows a single measurement from a buoy on the equator all the way to the evening news.
Questions
How far ahead can El Niño be predicted?
Often six to nine months ahead once conditions are developing, but forecasts made in the northern spring are less reliable because of the spring predictability barrier.
What is the difference between an El Niño Watch and an El Niño Advisory?
A Watch means conditions are favourable for El Niño to develop within the next six months. An Advisory means El Niño conditions are observed and expected to continue.
When does NOAA update the El Niño forecast?
NOAA's Climate Prediction Center issues the ENSO Diagnostic Discussion on the second Thursday of each month.
What is the spring predictability barrier?
It is the drop in El Niño forecast skill for forecasts made in the northern spring, when the tropical Pacific is in transition and small wind changes can decide whether an event develops.