At a glance
The "SO" in ENSO stands for Southern Oscillation. It is the atmosphere's side of the El Niño cycle: a large-scale swing in surface air pressure across the tropical Pacific and Indian Oceans. When pressure is high in the east it tends to be low in the west, and the other way round. Watching that swing is one of the oldest ways of spotting an El Niño.
A see-saw across an ocean
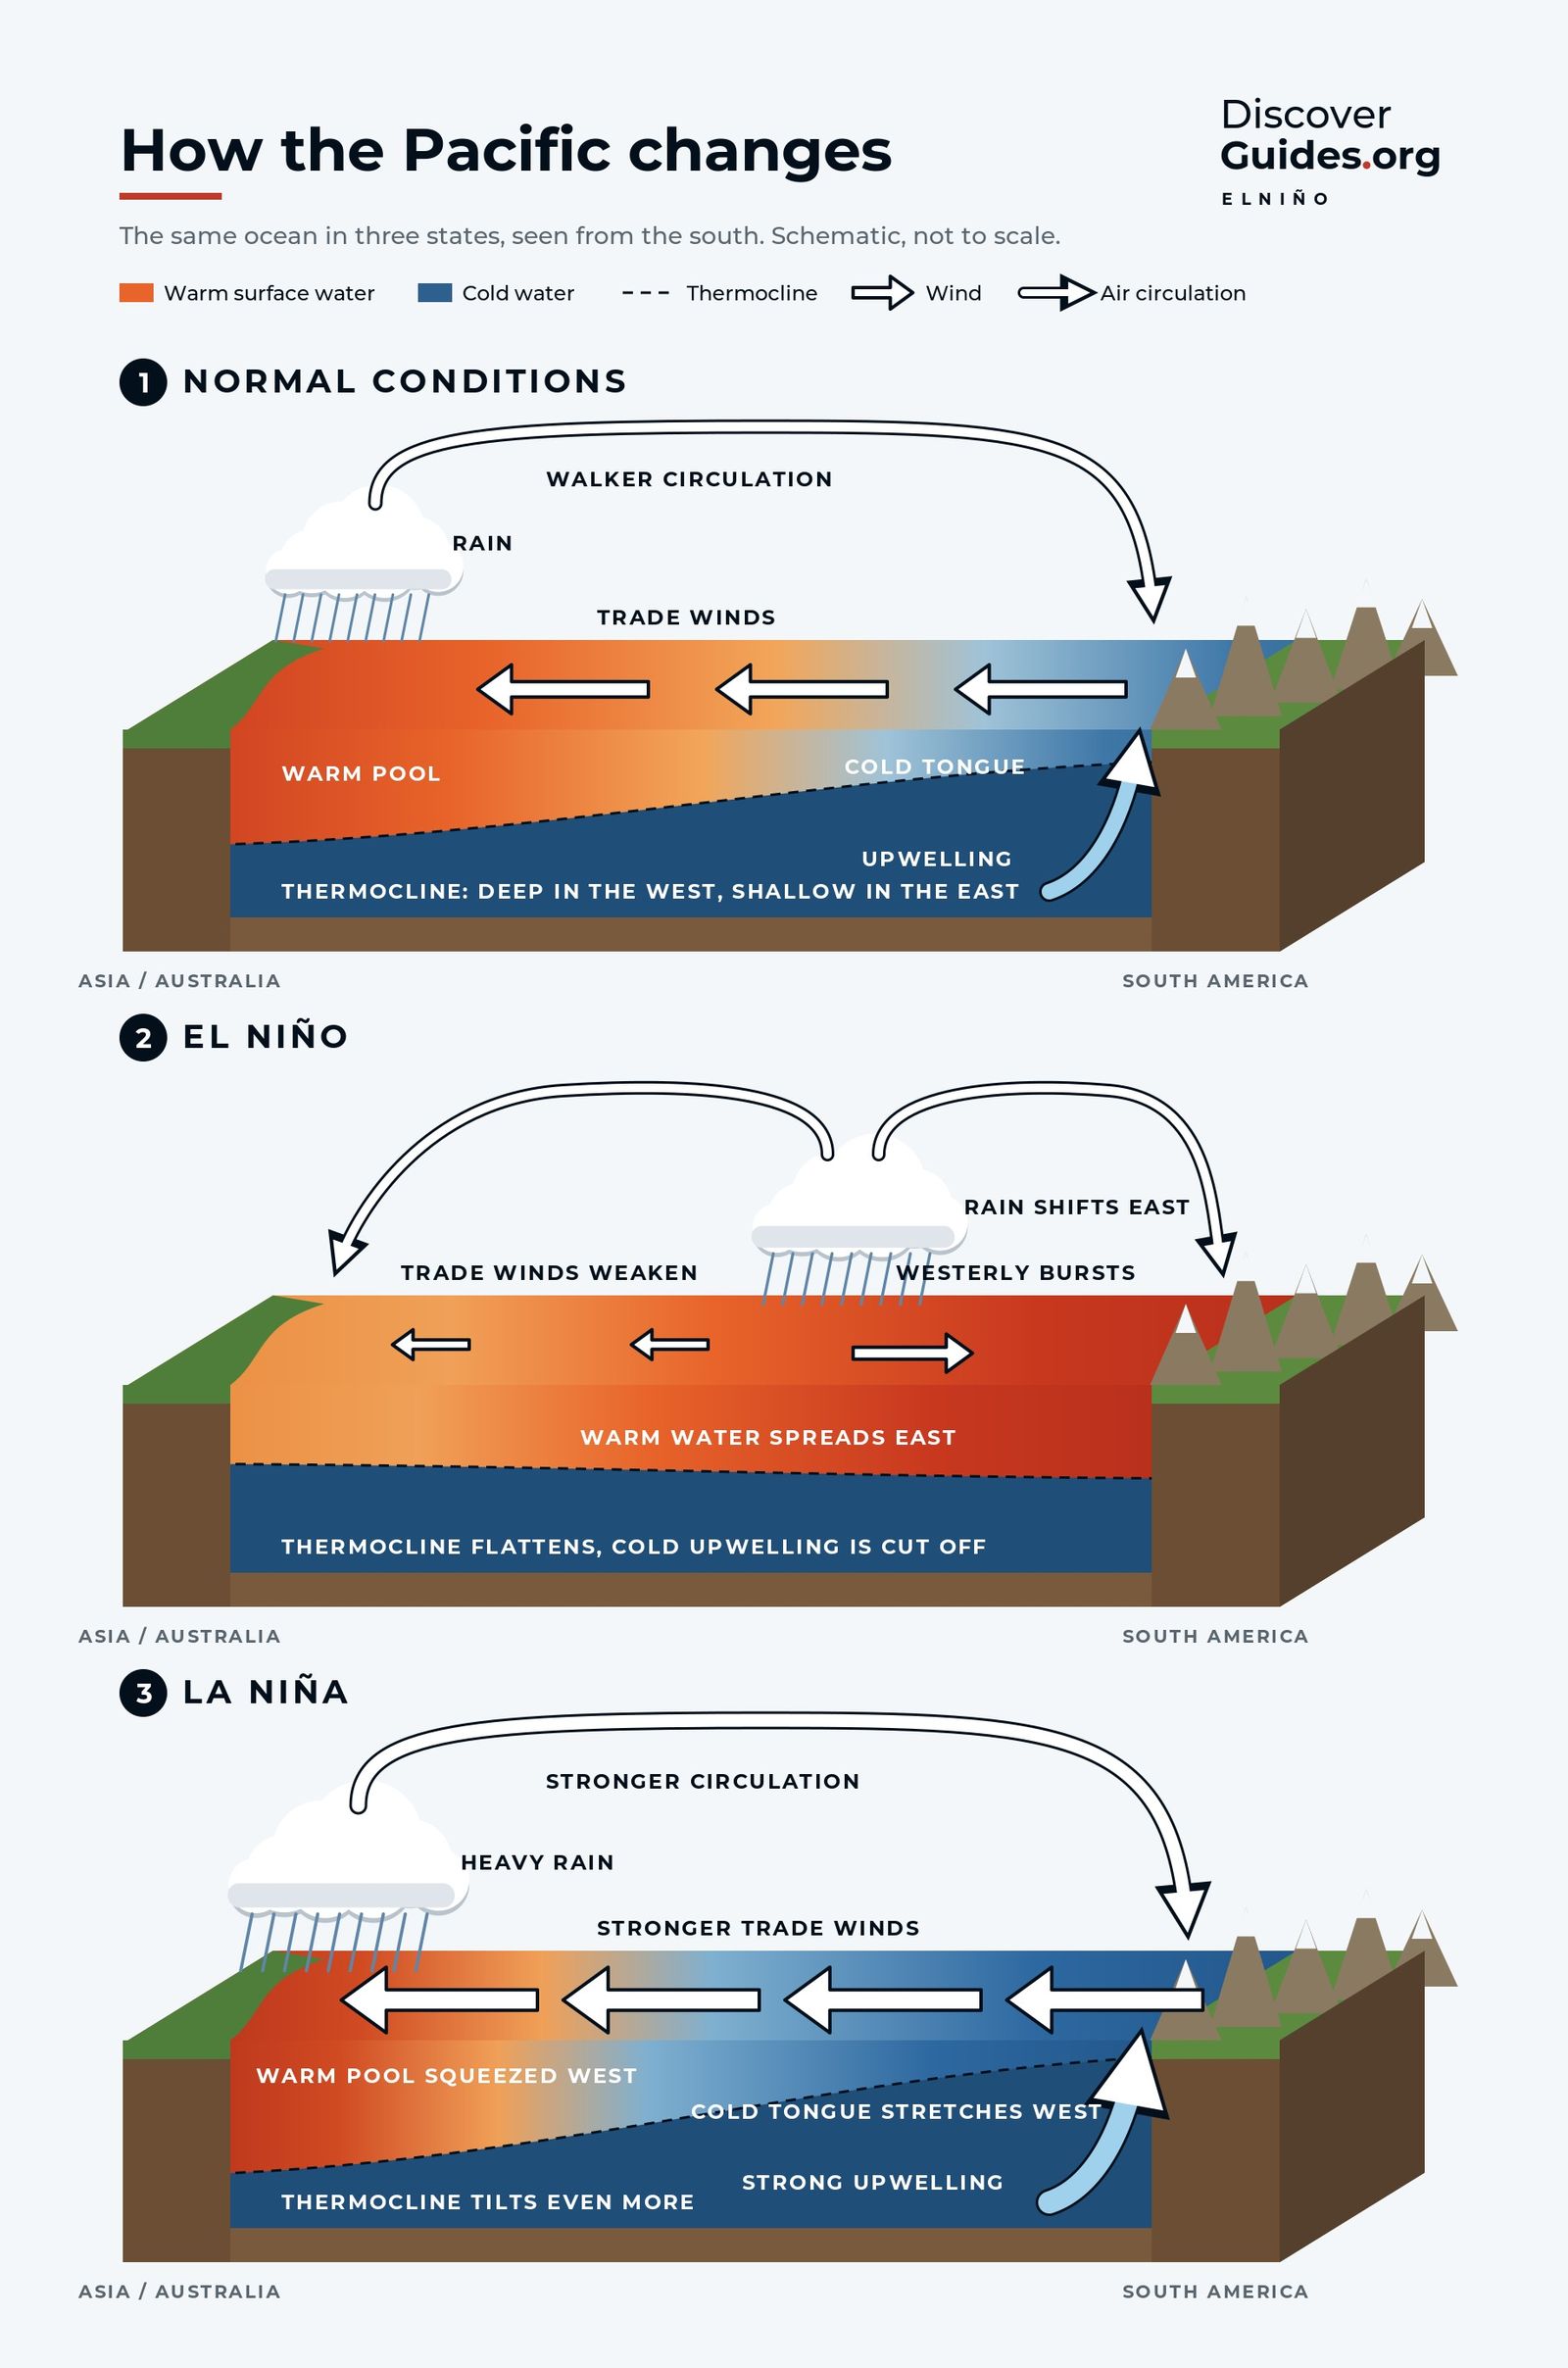
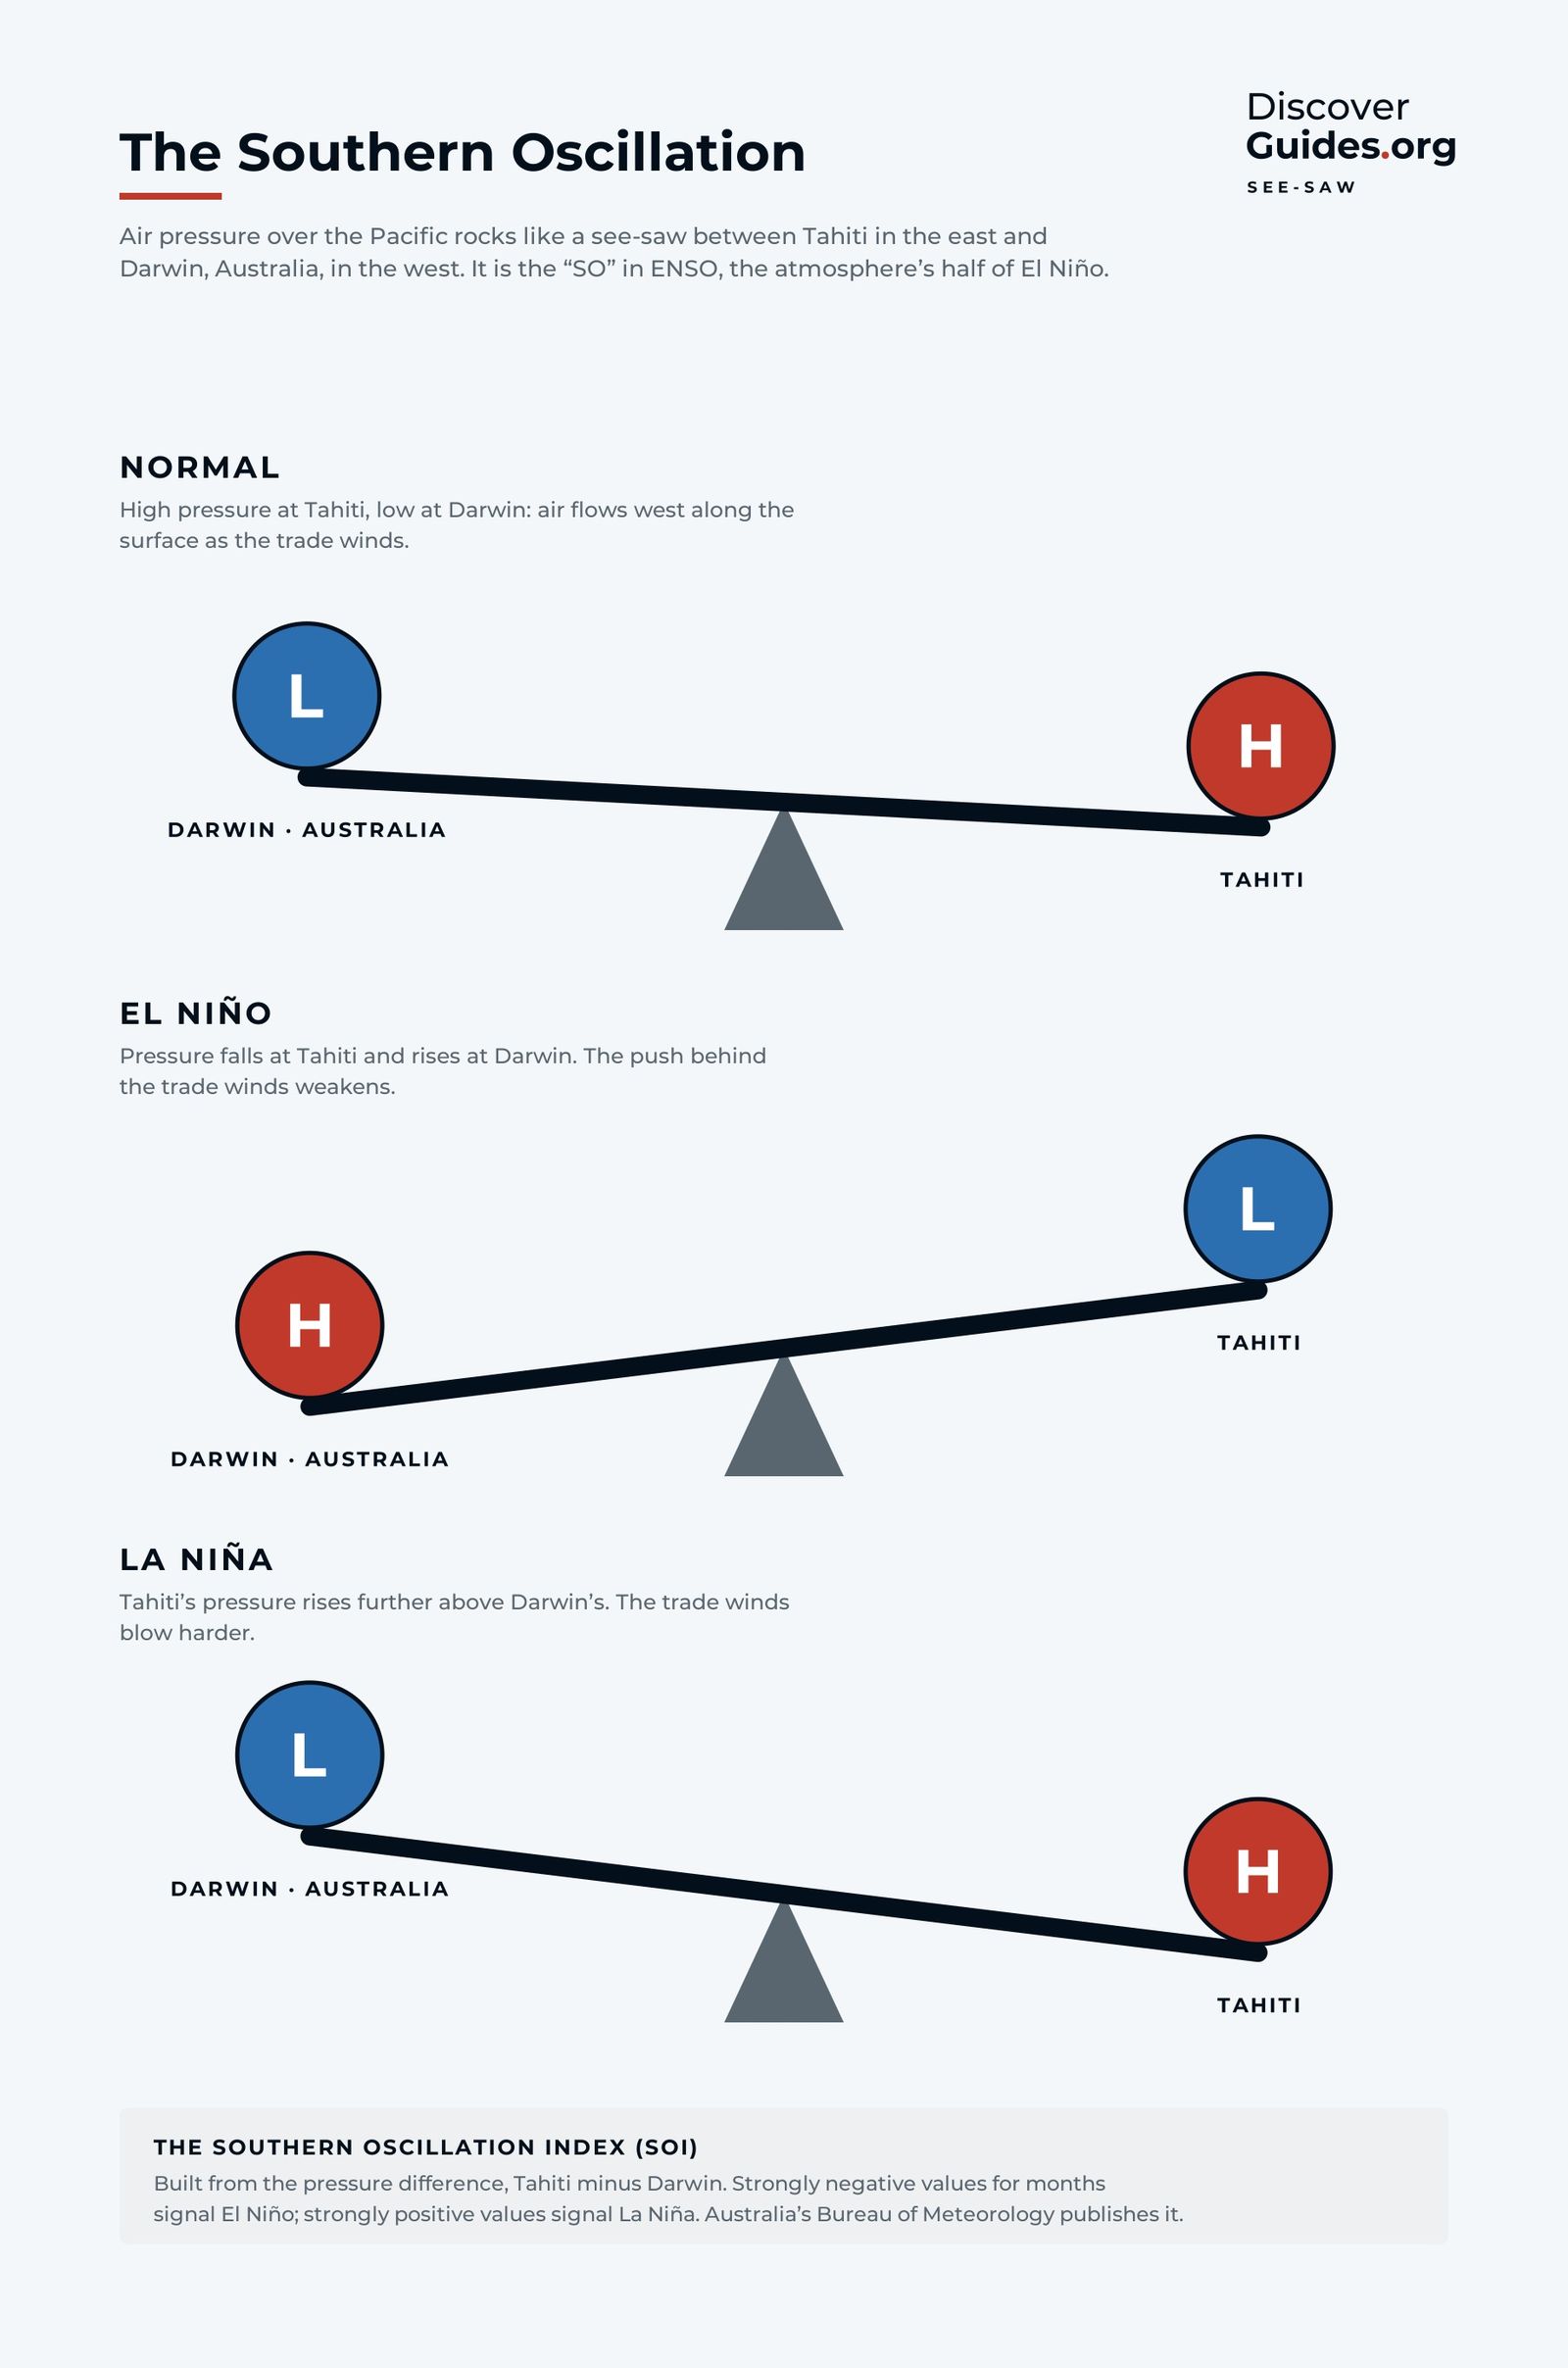
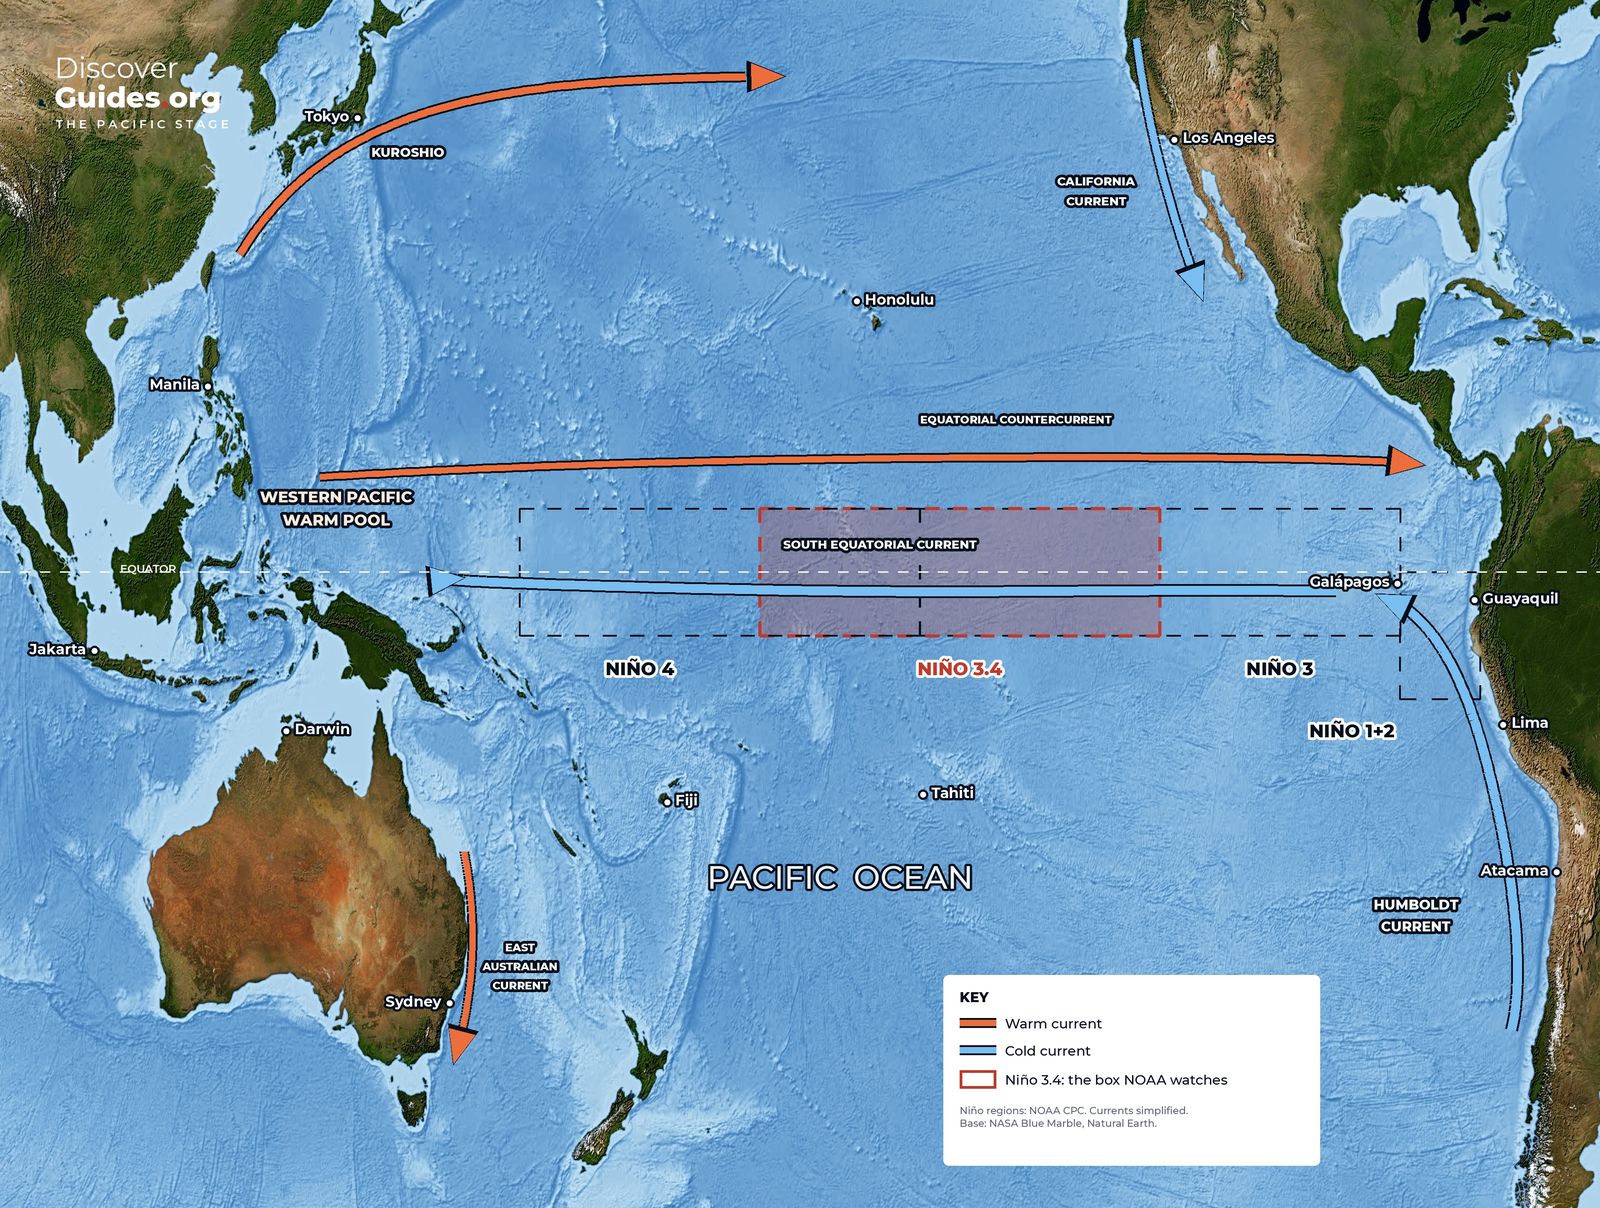
In normal conditions, air pressure is relatively high over the eastern Pacific, around Tahiti, and relatively low over the warm western Pacific, near northern Australia and Indonesia. Air flows from high to low pressure, so near the surface it moves west along the equator. Those are the trade winds.
During an El Niño, the see-saw tips the other way: pressure falls at Tahiti and rises at Darwin. The push behind the trade winds weakens, and the winds slacken or even reverse in the west. During La Niña, Tahiti's pressure rises further above Darwin's and the trades blow harder. The graphic at the top of this page shows the three positions.
This pressure swing and the ocean warming are not separate events. Weaker trade winds let warm water spread east; warmer water in the east lowers pressure there and weakens the trades further. The ocean and atmosphere drive each other, as described in How Does an El Niño Start?.
Sir Gilbert Walker and the monsoon
The see-saw was discovered by a mathematician who was trying to predict rain in India. Gilbert Walker became head of the India Meteorological Department in 1904, after devastating monsoon failures and famines in the late 19th century. He gathered pressure, temperature and rainfall records from around the world and searched them for patterns that might warn of a poor monsoon.
He found several. The strongest was a seesaw in pressure between the Pacific and the Indian Ocean regions, which he described as the Southern Oscillation in papers published from the 1920s onwards. Walker noticed that a weak monsoon in India tended to coincide with one phase of it. What he could not yet explain was why.
That came decades later. In 1969 Jacob Bjerknes connected Walker's pressure see-saw with the warm water that appeared off Peru, showing they were two sides of the same Pacific cycle. He named the east-west loop of air over the equatorial Pacific the Walker circulation in Walker's honour. The idea is that El Niño and the Southern Oscillation are one system, which is why scientists now write ENSO.
How the SOI is calculated
The Southern Oscillation Index (SOI) turns the see-saw into a single number. Australia's Bureau of Meteorology uses a version known as the Troup SOI. In outline:
- Take the monthly mean sea-level pressure at Tahiti and subtract the pressure at Darwin.
- Compare that difference with its long-term average for the same month (the base period is 1933-1992).
- Divide by the usual spread (the standard deviation) for that month and multiply by 10.
The result usually falls between about -35 and +35. Because Tahiti comes first, a negative SOI means pressure at Tahiti is lower than usual relative to Darwin, the El Niño direction. A positive SOI points towards La Niña.
| SOI | What it suggests |
|---|---|
| Sustained below -7 | Often indicates El Niño: weaker trade winds, warmer central and eastern Pacific |
| Between -7 and +7 | Generally neutral |
| Sustained above +7 | Typical of La Niña: stronger trade winds, cooler central and eastern Pacific |
NOAA also publishes an equatorial SOI, which compares sea-level pressure over broad areas of the equatorial eastern Pacific and over Indonesia rather than at two single stations. Because it sits right on the equator, where the Walker circulation runs, it is a cleaner measure of the see-saw, but its record is shorter. Forecasters read both together.
Local tipThe key word is sustained. The Bureau of Meteorology notes that daily and weekly SOI values swing with passing weather systems and are not useful for climate purposes. Look at monthly values, and at several months in a row.
Why the SOI still matters
Today the headline measure of El Niño is sea-surface temperature in the Niño-3.4 region. NOAA's Climate Prediction Center uses a relative version of that index to declare El Niño and La Niña. But the ocean warming only becomes a true El Niño when the atmosphere responds, and the SOI is a direct measure of that response.
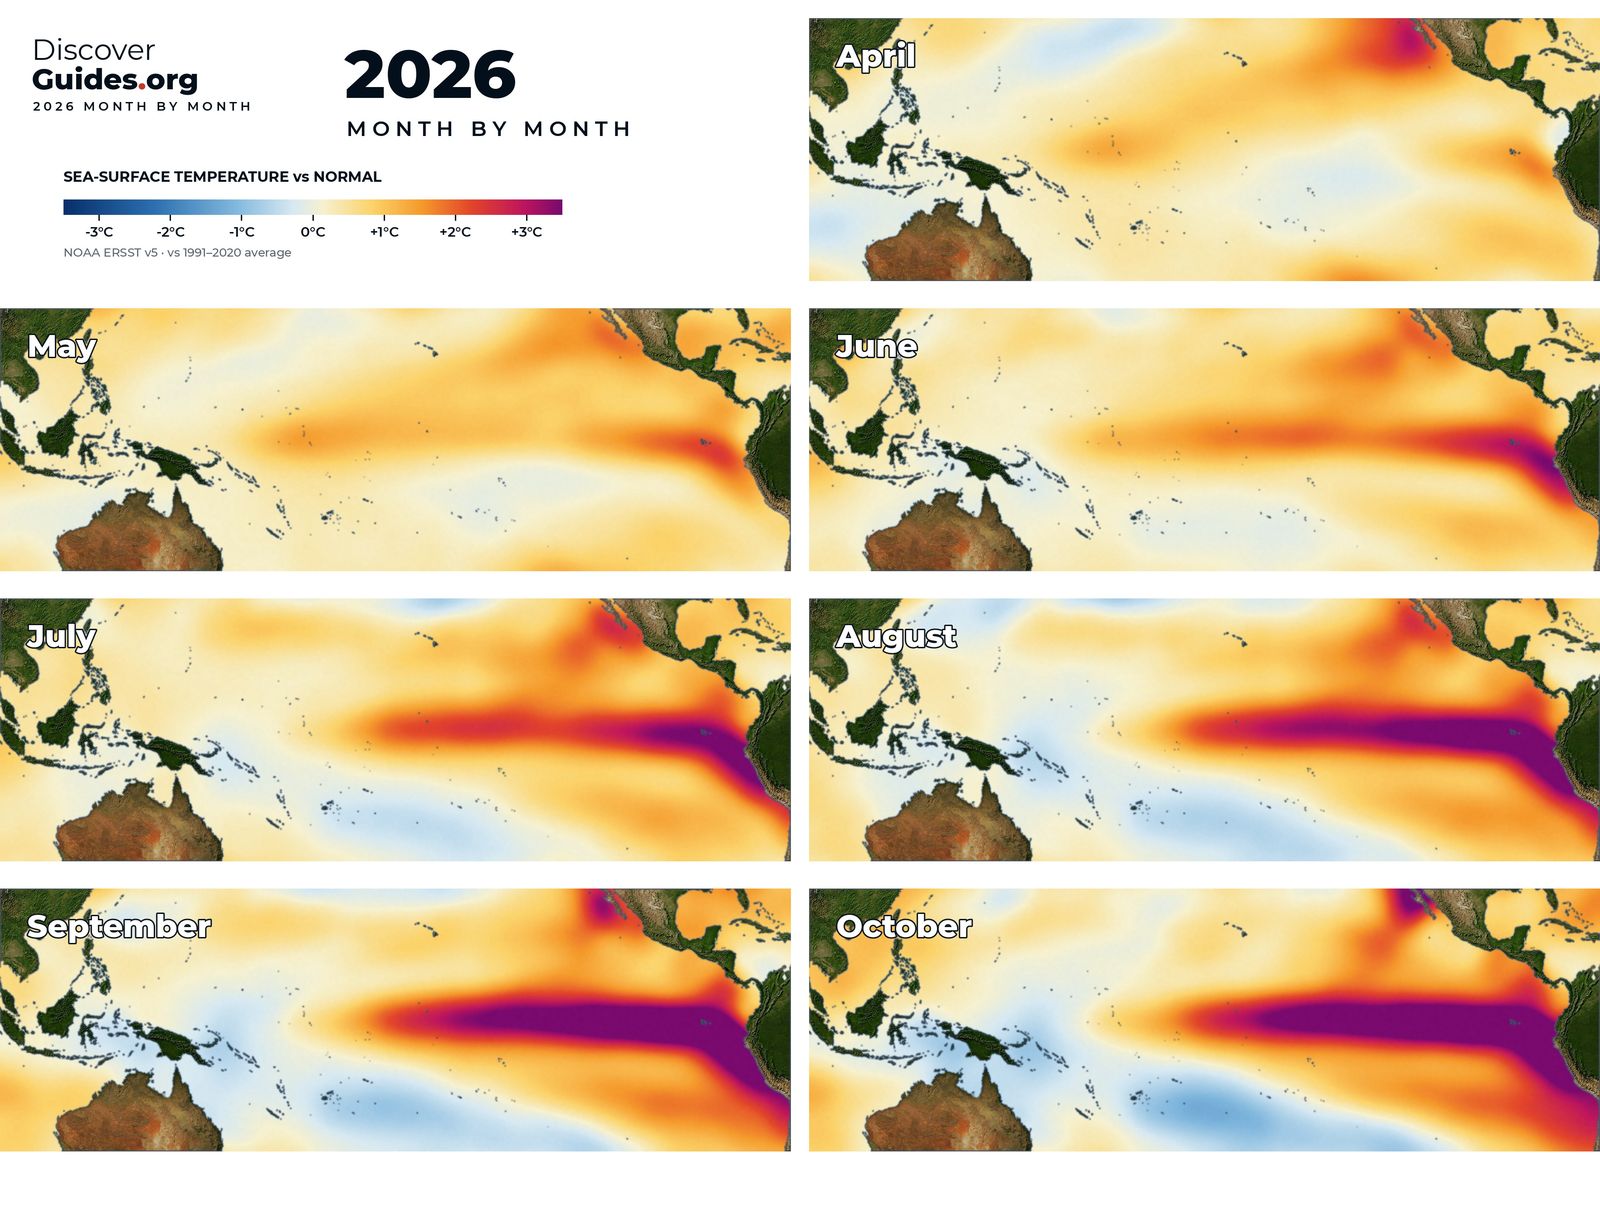
That is why forecasters look at both. A warm Niño-3.4 with a neutral SOI suggests the atmosphere has not yet joined in, and the warmth may not last. A warm Niño-3.4 with a strongly negative SOI means the two are coupled. As of NOAA's October 2026 update, both the traditional and the equatorial Southern Oscillation indices were significantly negative, consistent with the strong El Niño described in The 2026-27 Super El Niño.
The SOI also gives the cycle a long memory. Pressure records from Darwin and Tahiti stretch back into the 19th century, which helps scientists reconstruct past events such as the Great El Niño of 1877-78. For how the ocean side is measured and forecast, see How El Niño Forecasts Are Made. The full history, from Walker's monsoon tables to modern satellites, is in Discover El Niño.
Questions
What is the Southern Oscillation?
The Southern Oscillation is a see-saw in surface air pressure between the eastern and western tropical Pacific. When pressure is high near Tahiti it tends to be low near Darwin, Australia, and vice versa. It is the atmospheric half of ENSO.
What does a negative SOI mean?
A sustained negative Southern Oscillation Index, below about -7, often indicates El Niño: pressure is relatively low at Tahiti, the trade winds are weaker, and the central and eastern Pacific is warmer than normal.
Who discovered the Southern Oscillation?
Sir Gilbert Walker, head of the India Meteorological Department from 1904, described it in the 1920s while searching for ways to predict the Indian monsoon.
Why are Tahiti and Darwin used for the SOI?
They sit on opposite sides of the Pacific pressure see-saw and both have long, reliable pressure records, so the difference between them captures the swing well.