At a glance
Fifteen years earlier, the 1982-83 El Niño had grown unseen (see the giant nobody saw coming). By 1997 the picture had changed completely. A line of moored buoys spanned the equatorial Pacific, satellites measured sea level from orbit, and computer models had been trained on more than a decade of new data. 1997 was the test.
Watched from the start
Warming in the eastern Pacific was evident by early April 1997. In June, NOAA's Climate Prediction Center issued an advisory noting the largest anomalies in the central and eastern Pacific since 1983, and models predicted that strong conditions would last into early 1998. NOAA issued its winter outlooks for the United States in late June, and they largely verified.
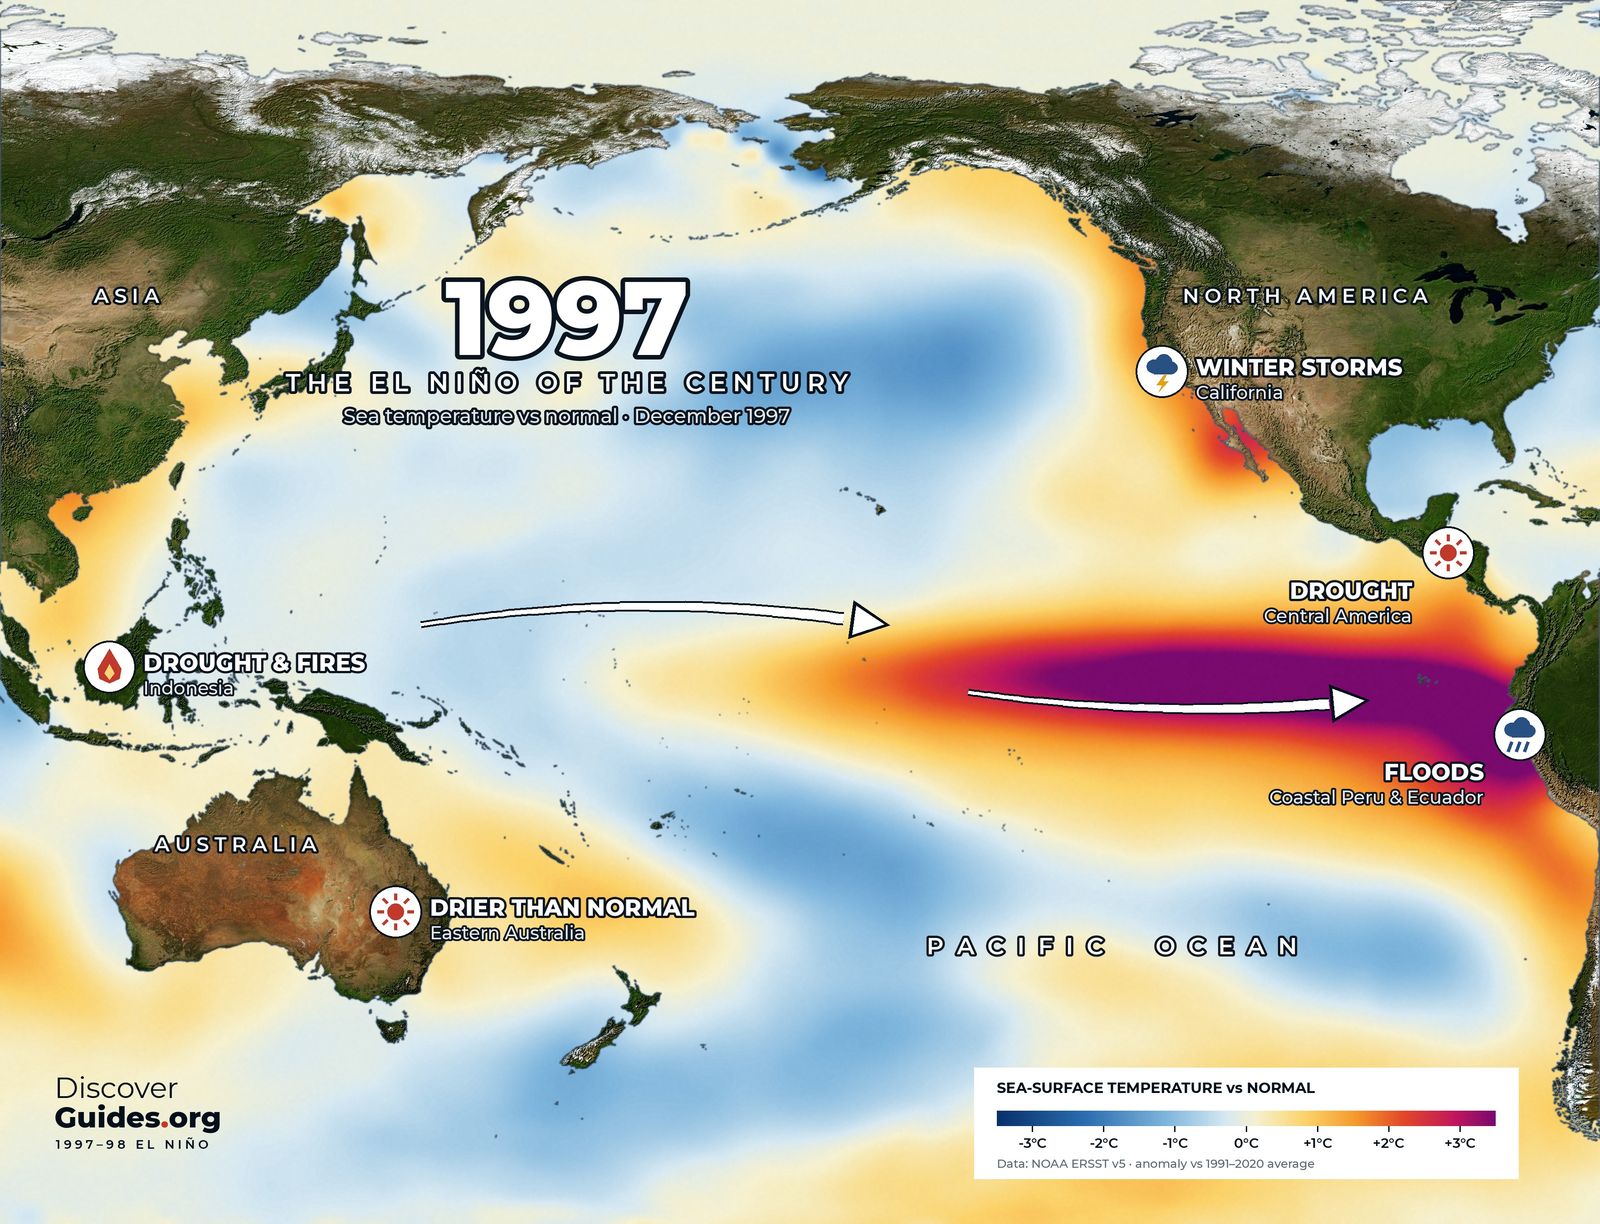
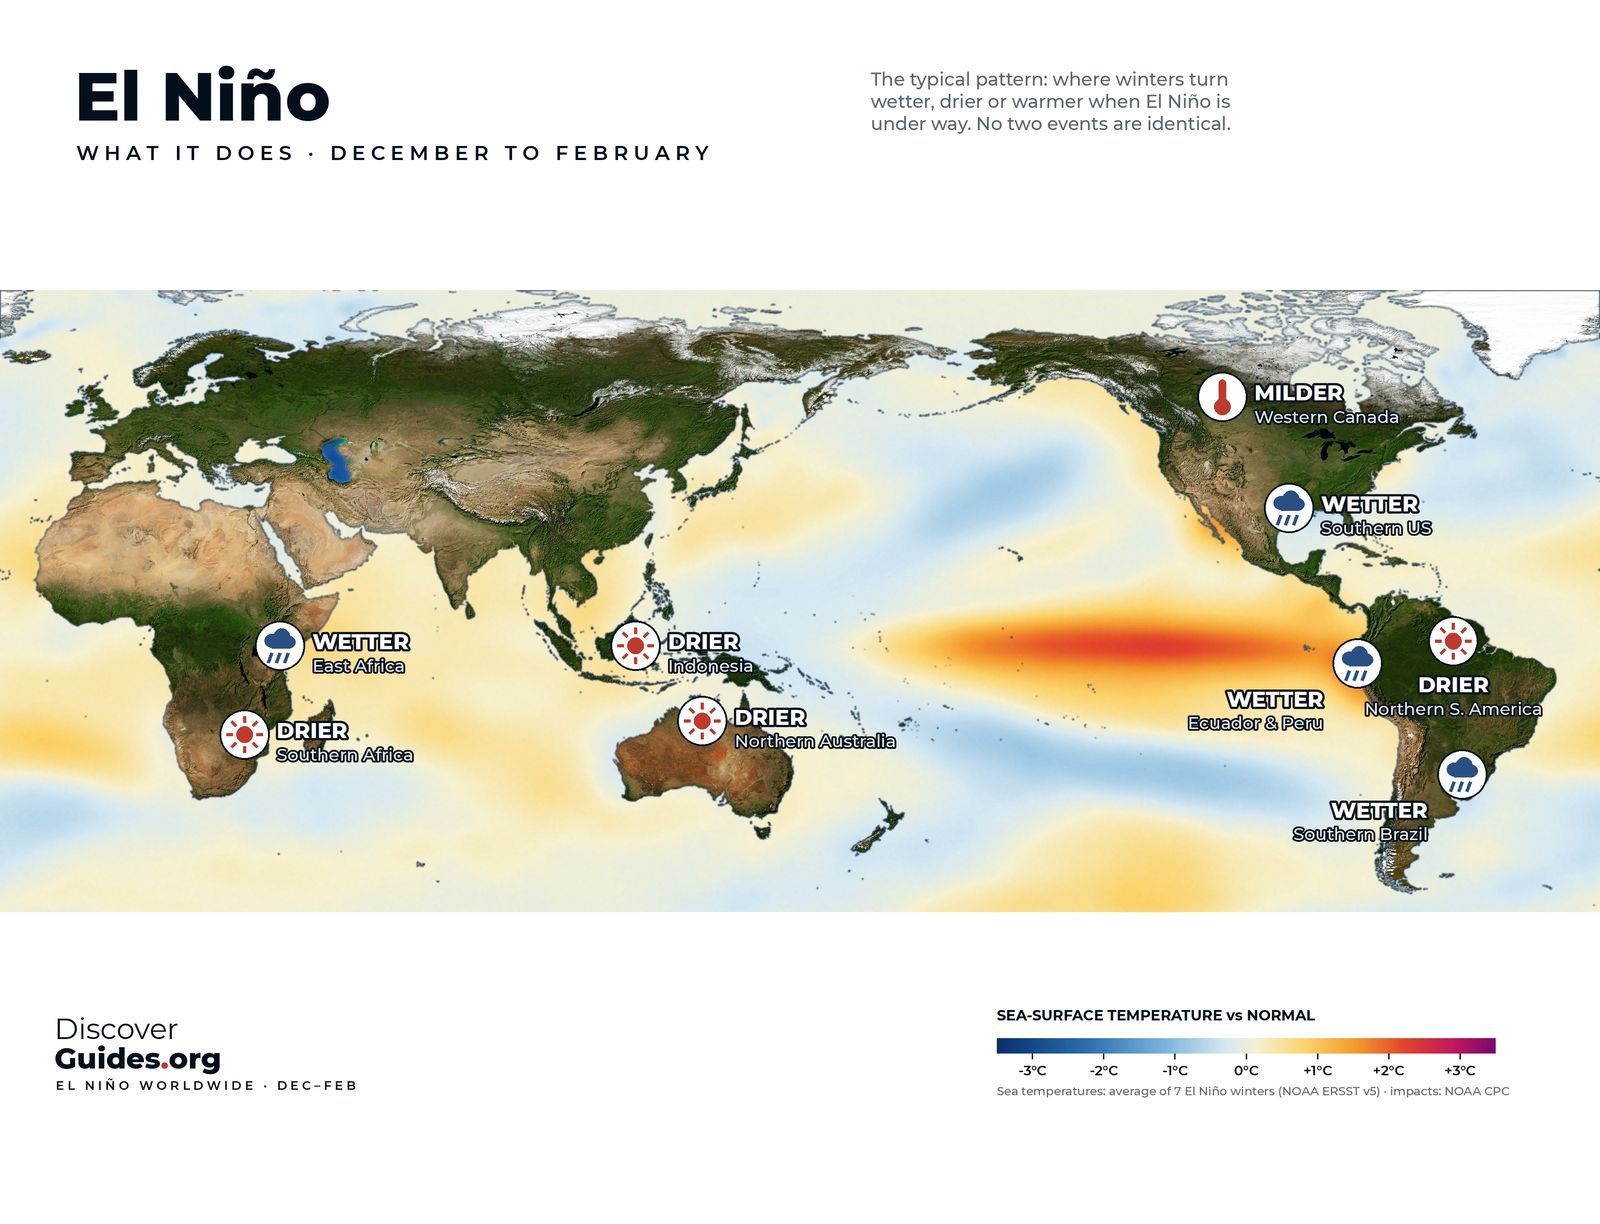
The event grew through the northern summer and autumn and peaked in late 1997. The map above shows December 1997: the warmest water, more than 3°C above normal, pressed against the coasts of Ecuador and Peru, with a warm streak running far up the coast of North America.
What the buoys saw
The new instruments let scientists watch the event's machinery for the first time. Bursts of westerly wind in the western Pacific from late 1996 into 1997 sent pulses of warm water east below the surface as Kelvin waves. The buoys tracked each pulse as it pushed the thermocline down on its way to South America, and satellites saw the matching bump in sea level. The process is explained step by step in how an El Niño starts.
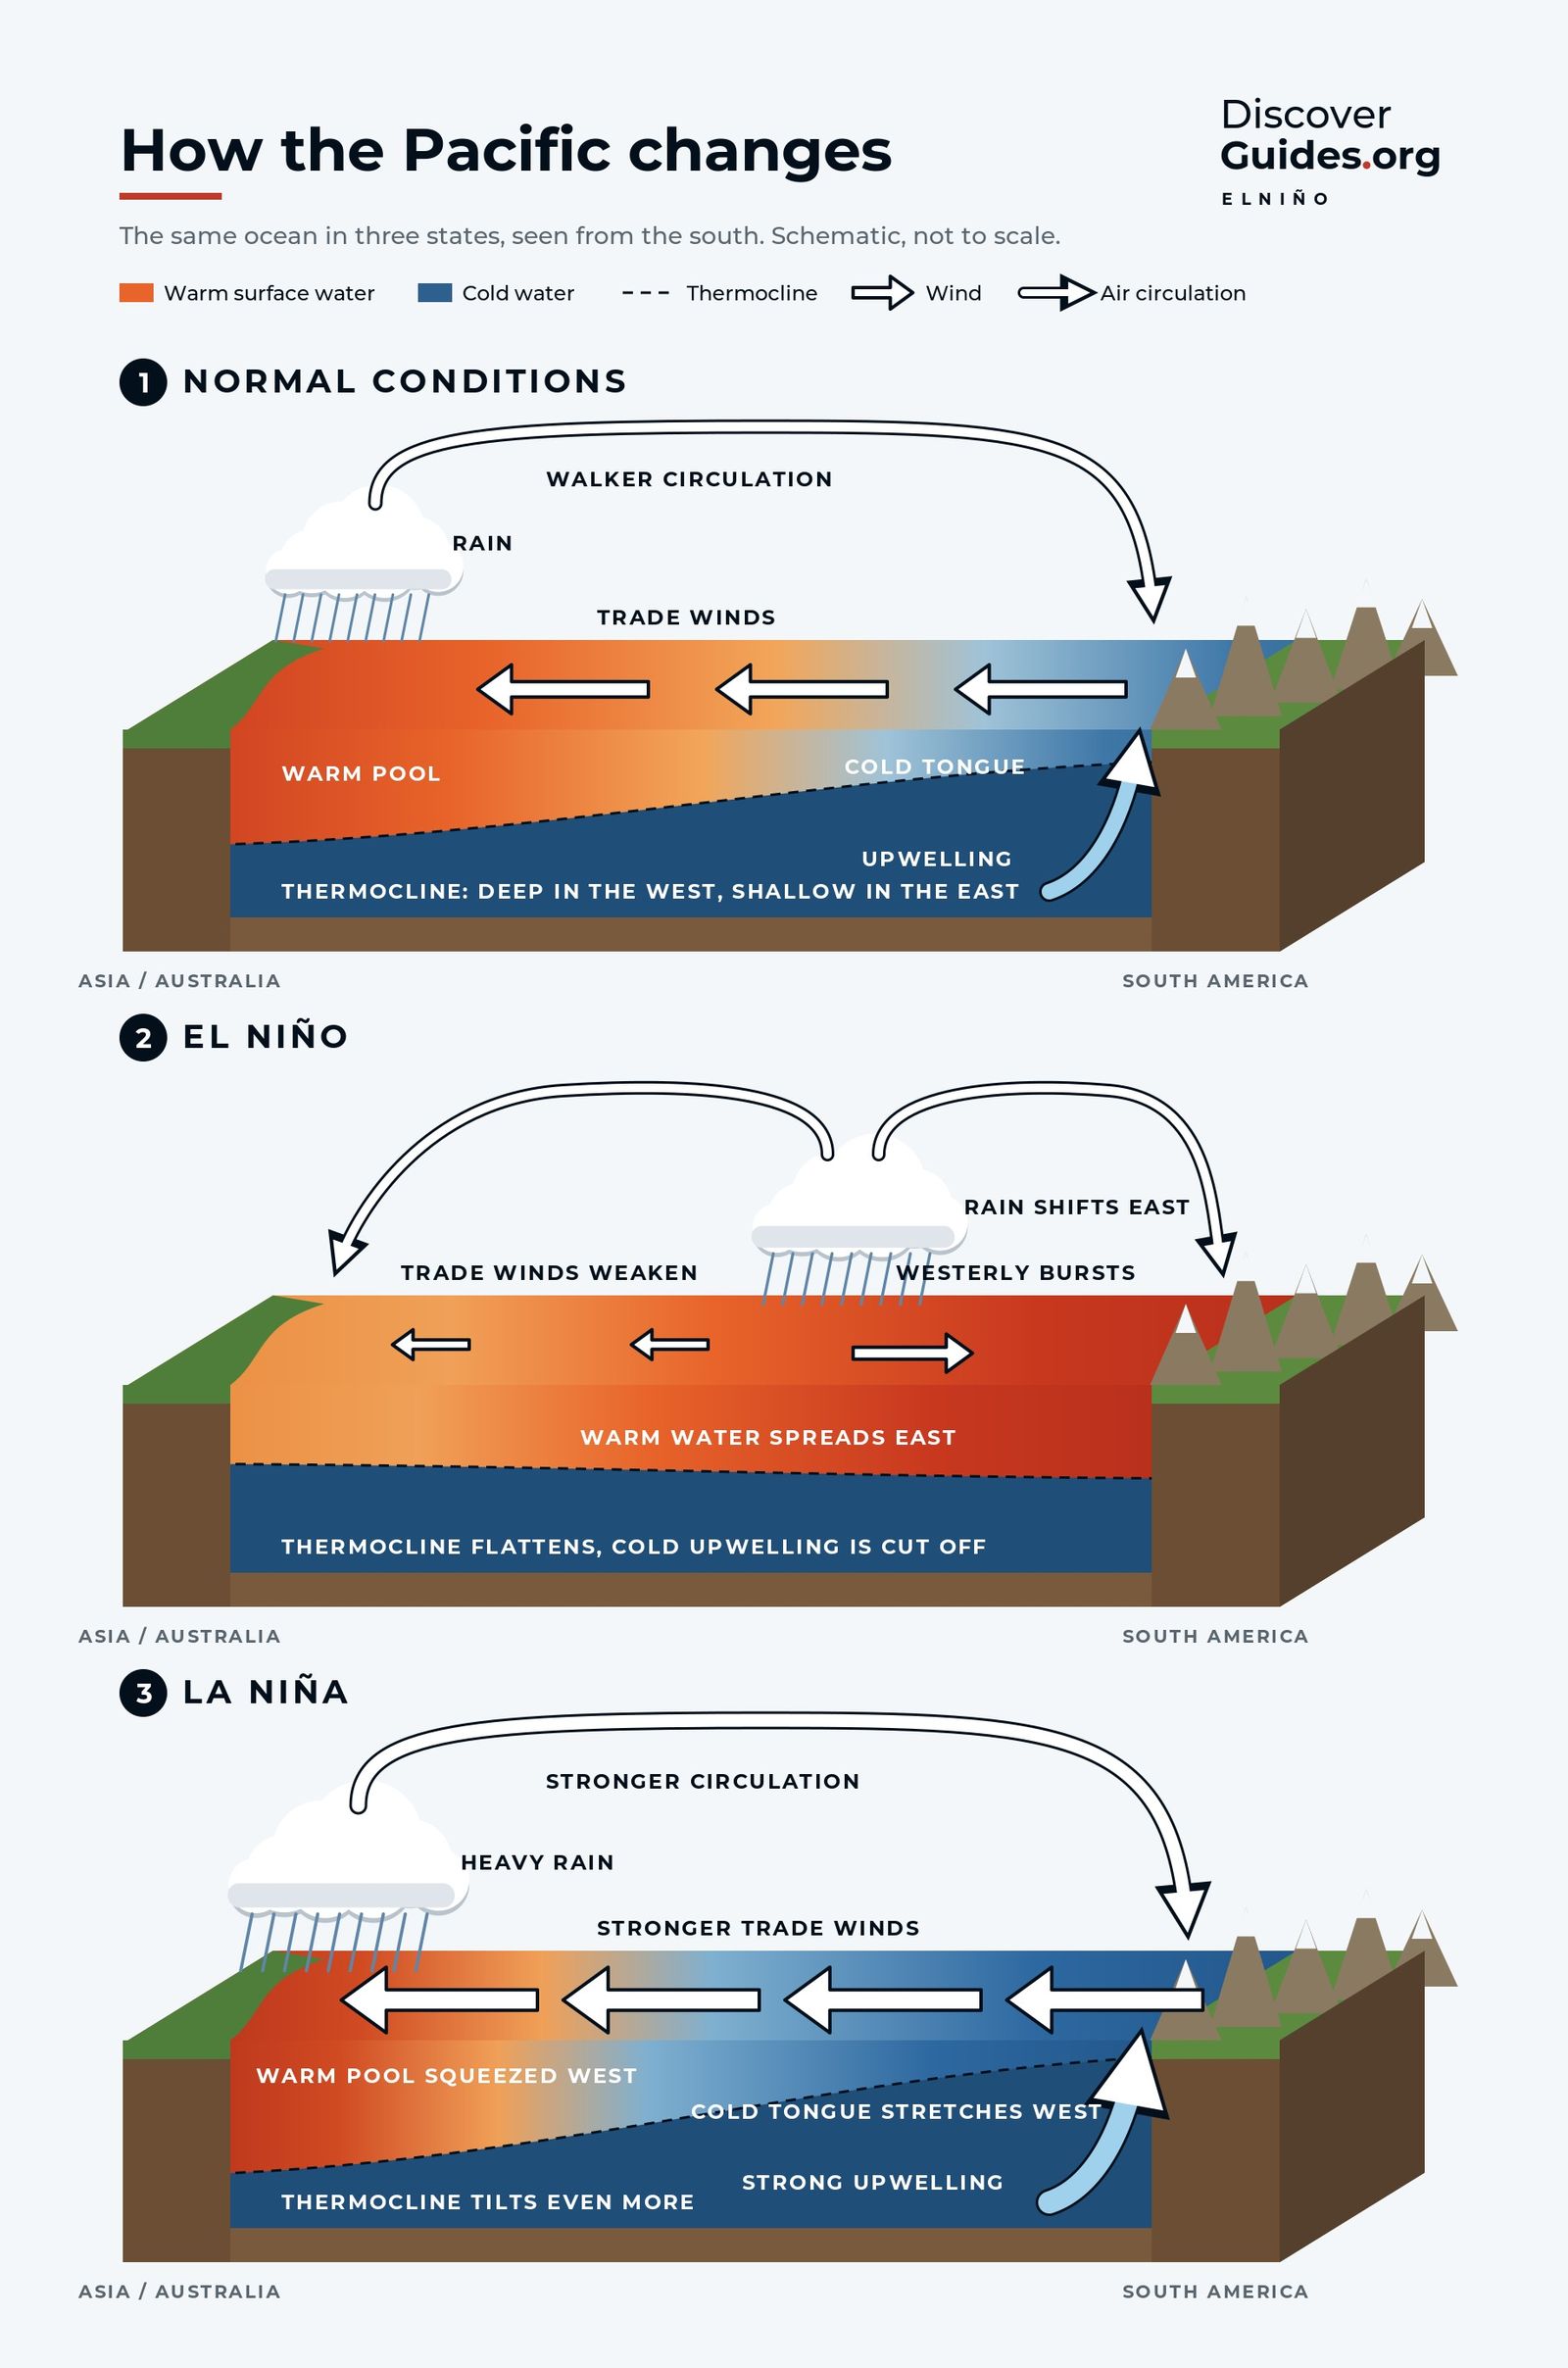
By the second half of 1997 the usual east-west tilt of the Pacific had almost vanished. The trade winds had collapsed across much of the basin, the warm pool had spread east, and rainfall over Indonesia had shifted to the central Pacific.
How strong was it?
On NOAA's traditional Oceanic Niño Index, 1997-98 peaked at about +2.4°C (4.3°F) over November to January, second only to 2015-16 since 1950. On the relative index NOAA adopted in 2026, which removes the background warming of the tropics, it peaked at about +2.3°C, level with 2015-16 and just behind 1982-83. On any measure, it belongs with the strongest El Niños in history.
Fire, flood and storm
- Indonesia. Drought let fires, many lit to clear land, burn through forest and peat on Sumatra and Borneo. Smoke and haze spread across Southeast Asia for months.
- Peru and Ecuador. Torrential rain on the desert coast brought floods and mudslides to the north of Peru and the coast of Ecuador.
- California. Winter storms brought flooding and landslides. NOAA puts the storm damage at about $1.1 billion, roughly half the 1982-83 toll, and credits the early outlooks with helping people prepare.
- East Africa. Heavy rain and floods in late 1997 across Kenya, Somalia and neighbouring countries.
- Central America and Mexico. Drought, followed by severe fire seasons in 1998.
- Eastern Australia. Drier than normal, though far less severe than 1982-83.
The exceptions matter as much as the hits. Southern Africa, braced for drought because of El Niño's usual pattern, had a far milder season than feared. A forecast gives the odds, and the odds do not always come in.
The year the corals turned white
Heat stress followed the warm water. In 1998 corals bleached on reefs across the Indian Ocean, the Pacific and the Caribbean, in what NOAA counts as the first global coral bleaching event. The Global Coral Reef Monitoring Network later estimated that about 16% of the world's reefs were seriously damaged or destroyed that year, with the Indian Ocean hit hardest. Why reefs react so strongly is covered in El Niño and coral bleaching.
The atmosphere warmed too. With El Niño releasing ocean heat on top of long-term warming, 1998 became the warmest year in the instrumental record at the time, a title it held until the mid-2000s.
A fast swing to La Niña
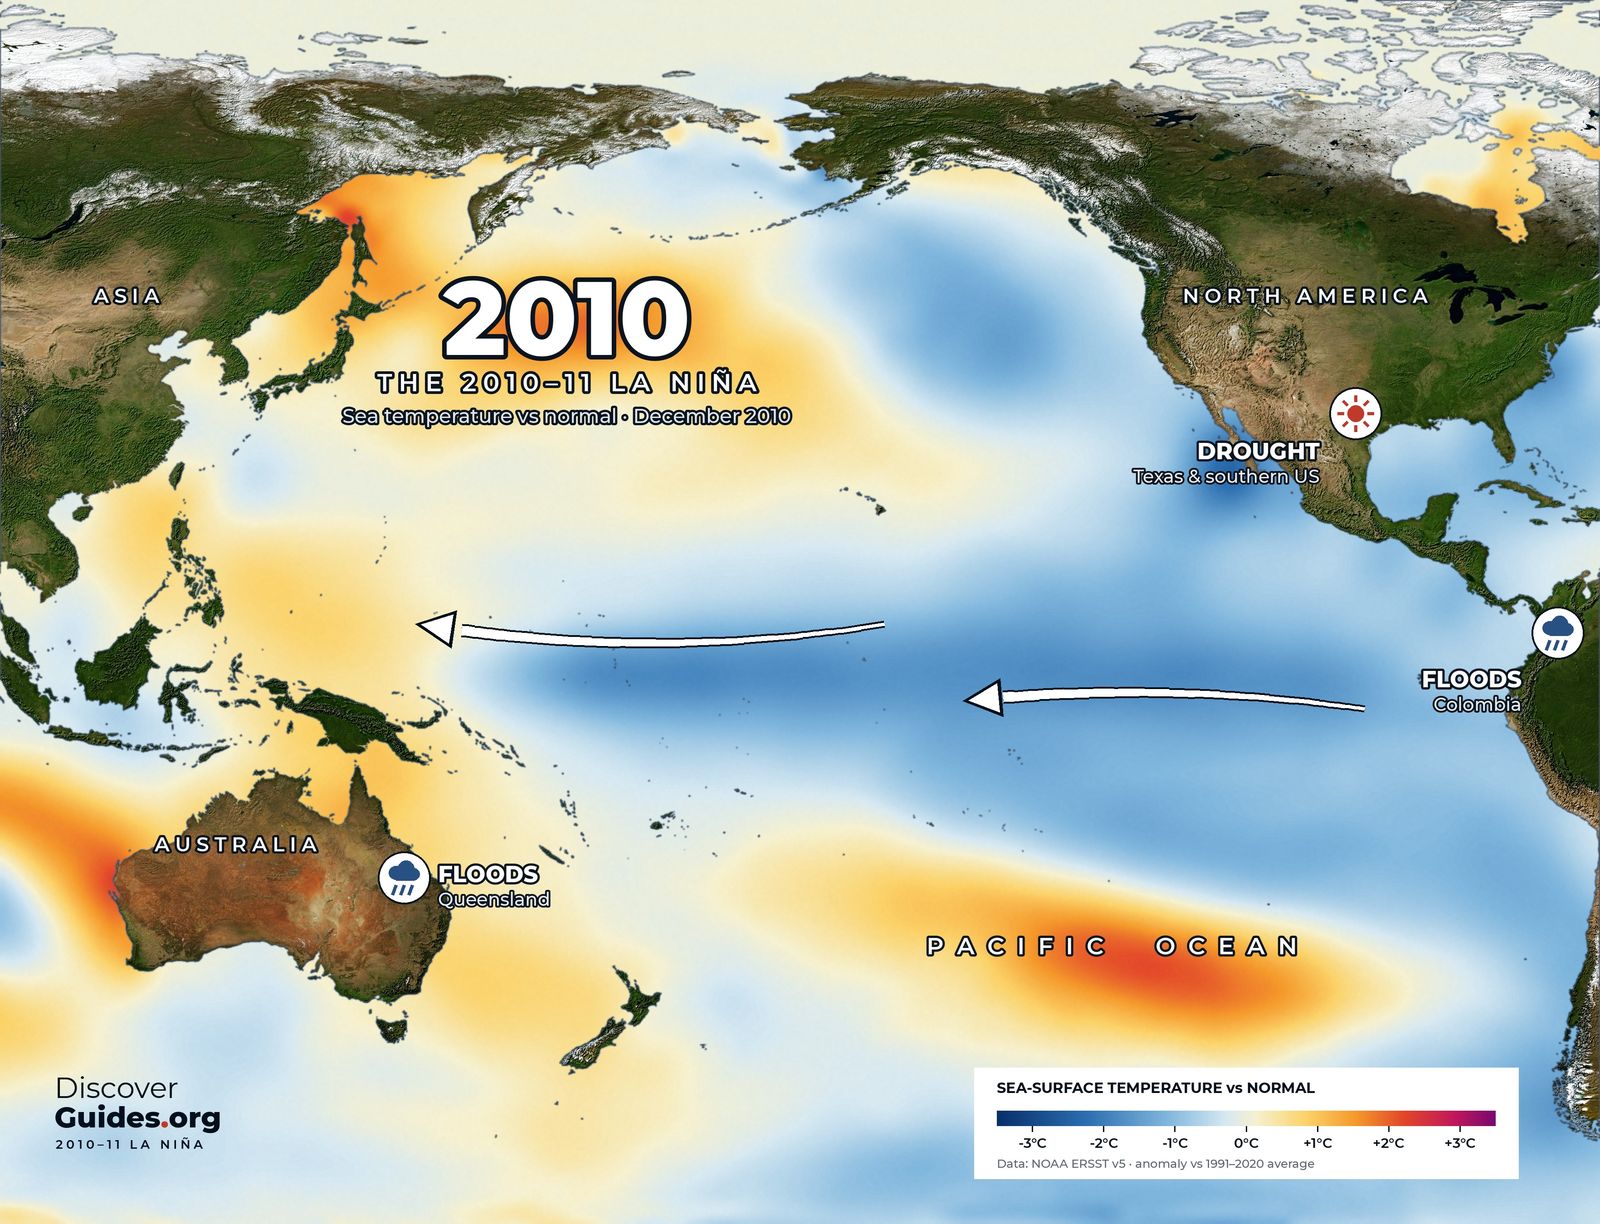
The event collapsed almost as fast as it grew. By mid-1998 the eastern Pacific had cooled, and the Pacific swung into a La Niña that lasted, with breaks, into early 2001. Strong El Niños often hand over to La Niña in this way, bringing a new set of floods and droughts with the opposite pattern.
Lessons from the event of the century
1997-98 proved that a great El Niño could be seen coming. Governments, farmers, insurers and water managers acted on the forecasts, and NOAA says the public had up to six months to prepare. It also showed the limits: a forecast describes probabilities for a season, not the weather on a given day in a given town.
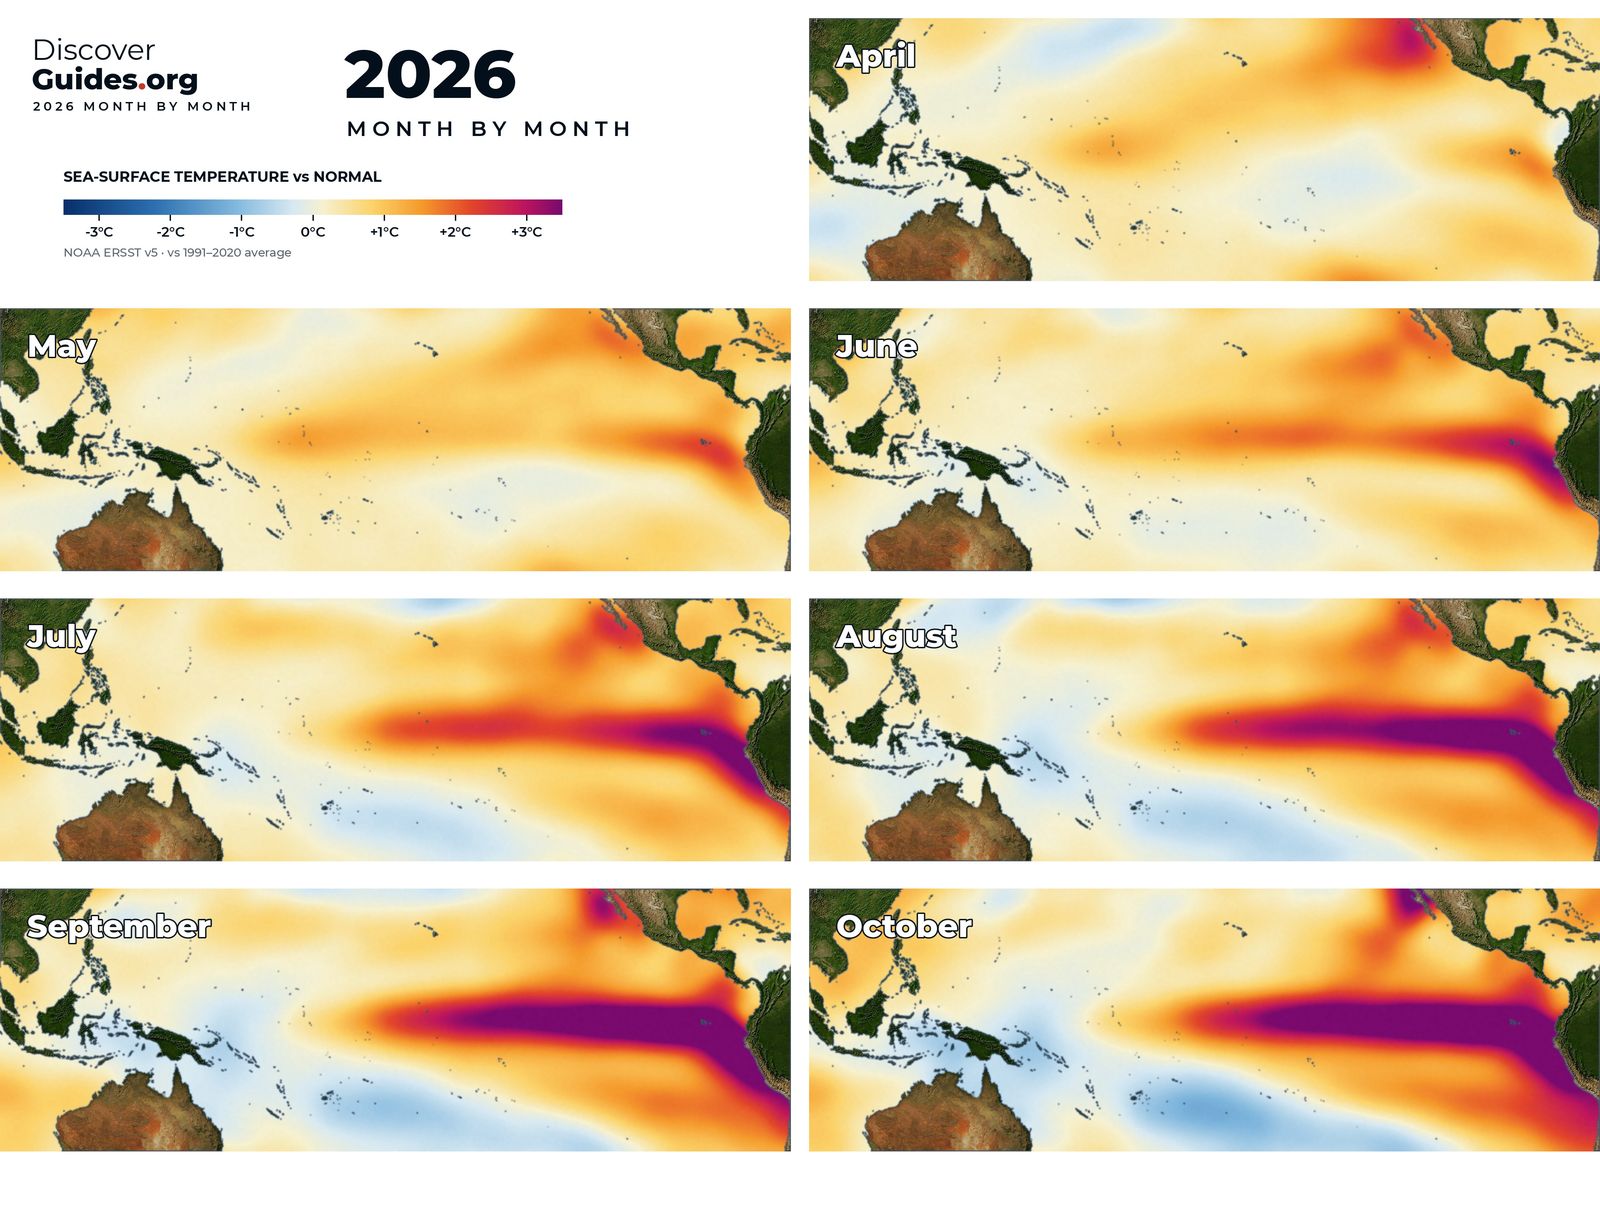
As of NOAA's October 2026 update, the 2026-27 event was on course to rival 1997-98, with an 83% chance of passing the historic +2.5°C mark on the relative index over October to December. Outlooks can change. The book Discover El Niño sets the two events side by side, month by month.
Questions
Why is 1997-98 called the El Niño of the century?
It was the strongest El Niño of the twentieth century on NOAA's traditional index, its impacts reached every continent, and it was the first giant event to be monitored in real time and forecast months ahead.
How strong was the 1997-98 El Niño?
It peaked at about +2.4°C on NOAA's traditional Oceanic Niño Index and about +2.3°C on the relative index NOAA now uses.
Was the 1997-98 El Niño predicted?
Yes. Warming was evident by April 1997, NOAA issued an advisory in June, and models correctly predicted that strong conditions would last into early 1998.
What were the effects of the 1997-98 El Niño?
Fires and haze in Indonesia, floods in Peru, Ecuador and East Africa, storms in California, drought in Central America, the first global coral bleaching event and a record-warm year in 1998.