At a glance
Global average surface temperature has risen by well over a degree Celsius since the late 19th century, mainly because of greenhouse gases from burning fossil fuels. Around that rising trend, the temperature wobbles from year to year. The biggest single source of those wobbles is the El Niño-Southern Oscillation.
How El Niño warms the planet
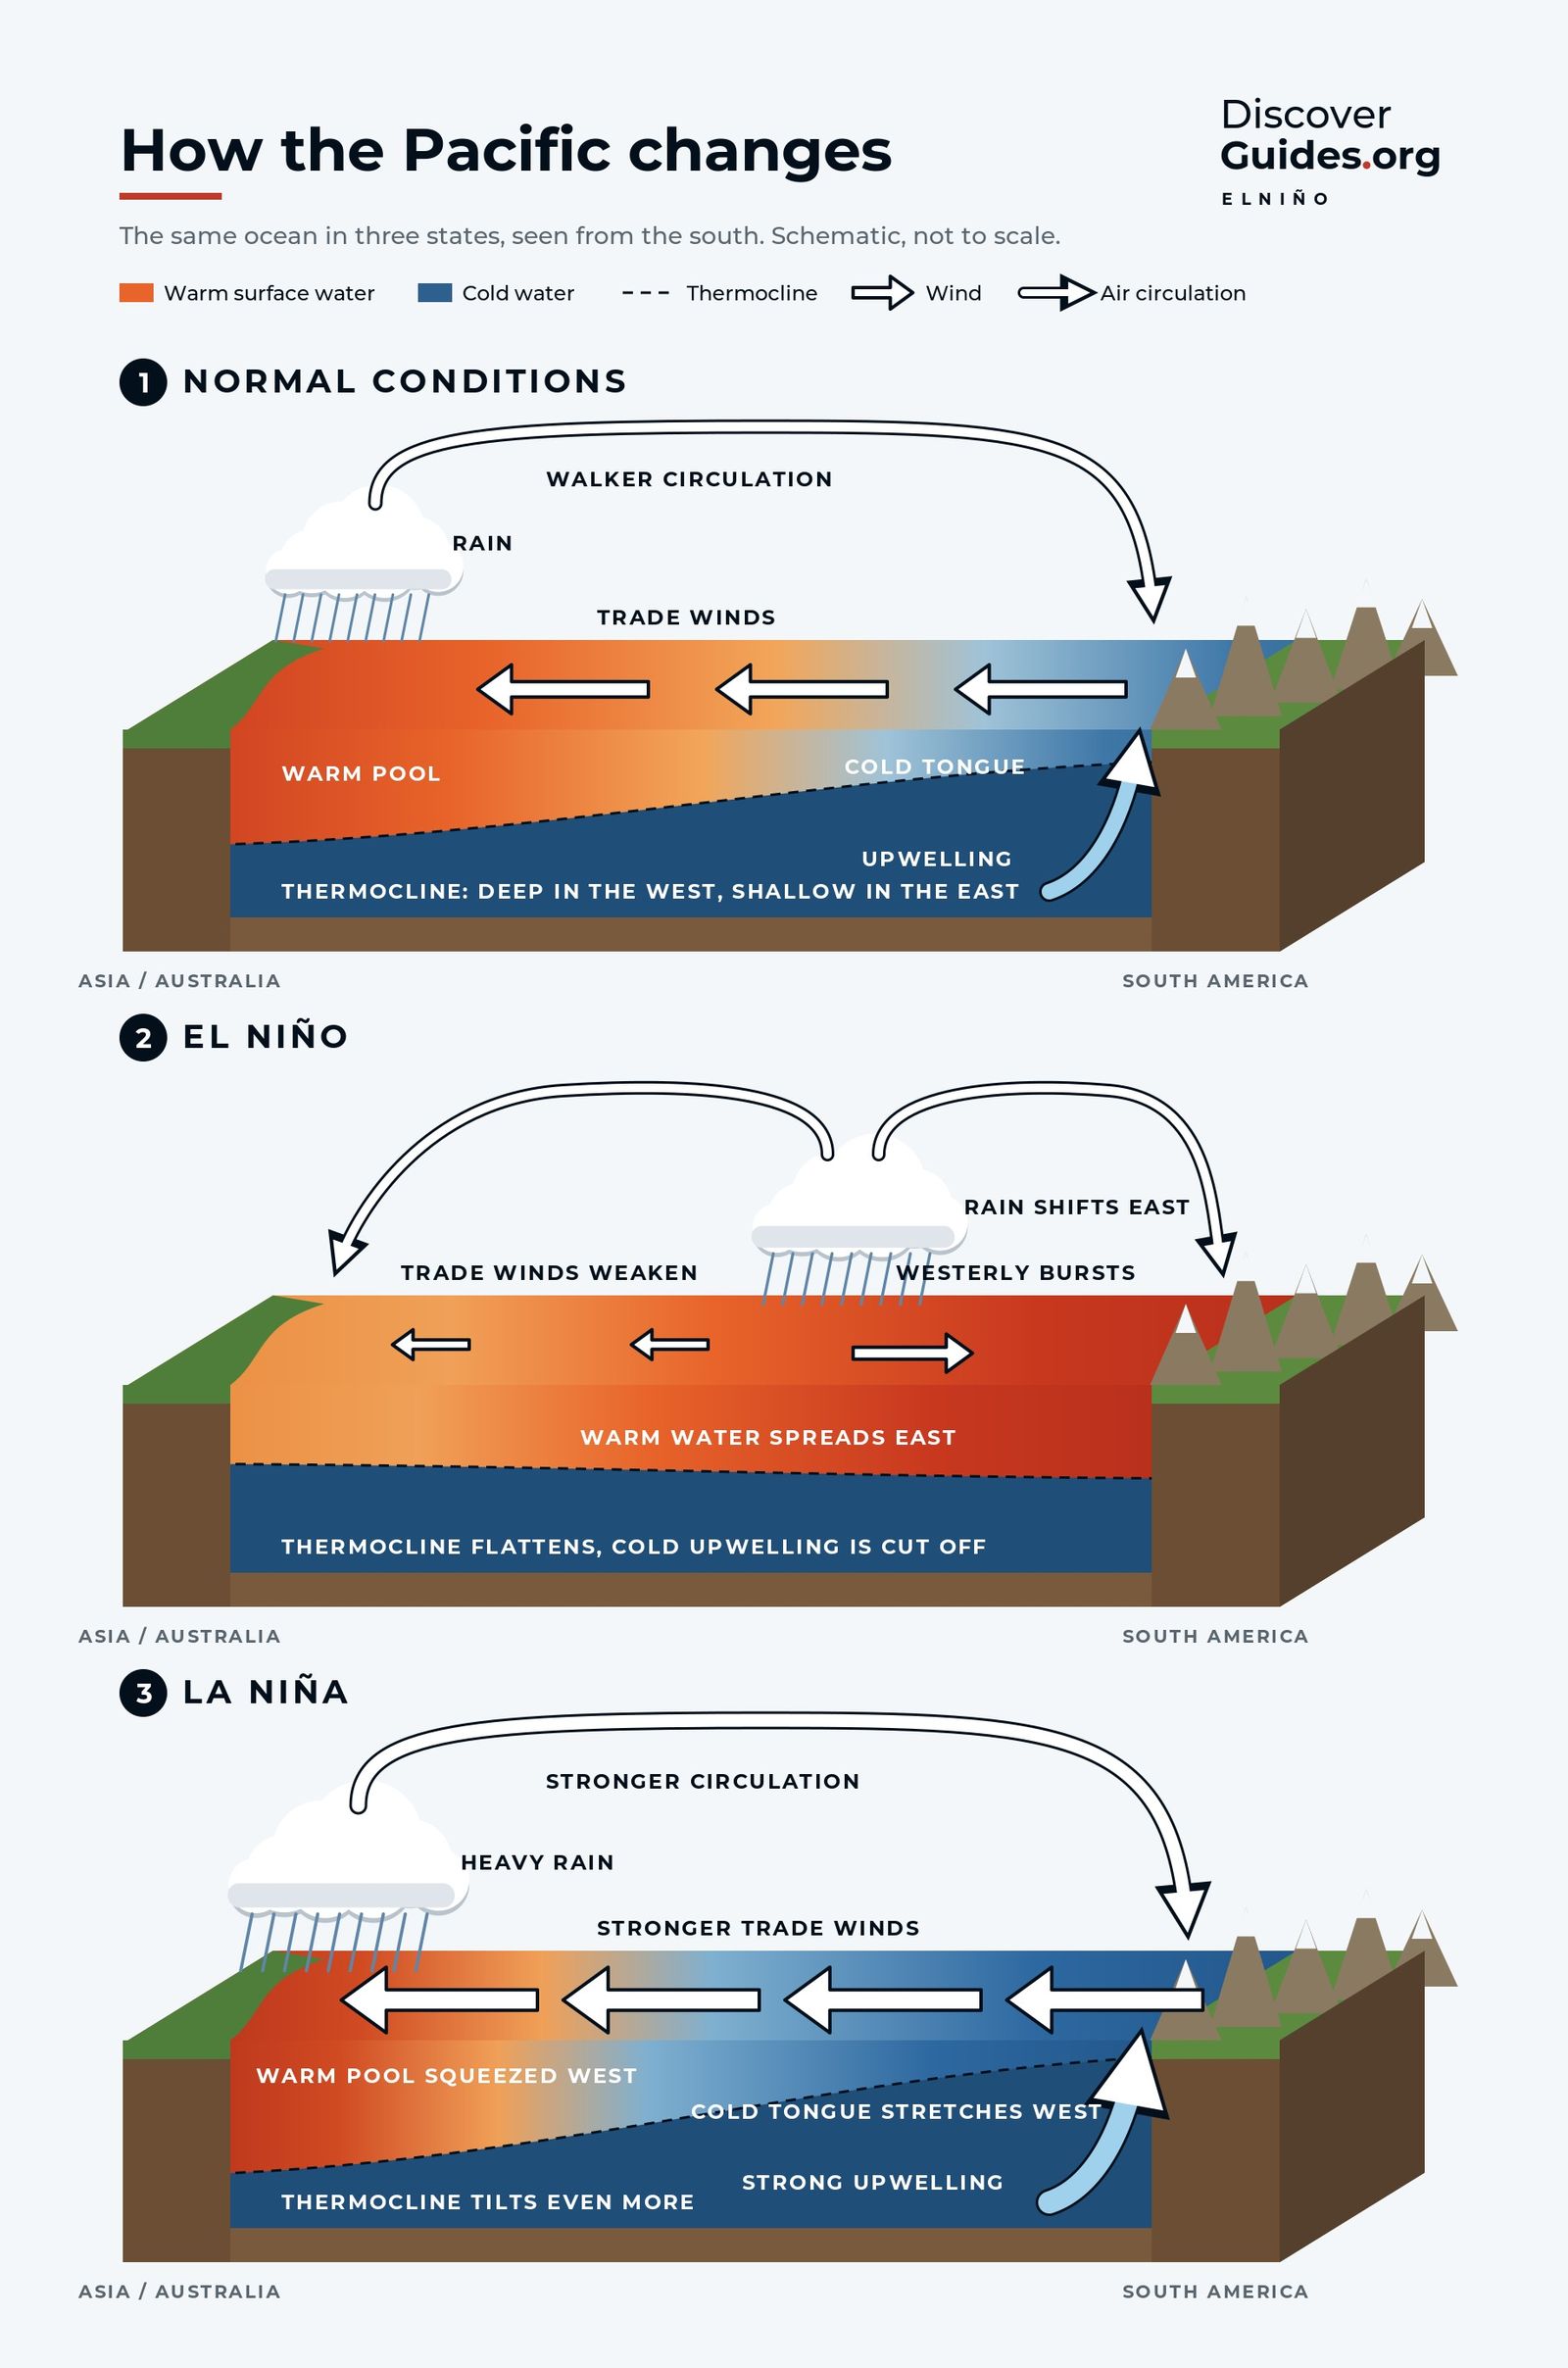
In normal years, the trade winds keep cold water welling up across the eastern tropical Pacific, and a great deal of heat is stored below the surface in the west. During an El Niño, the winds weaken, that warm water spreads across a vast area of the tropical Pacific, and the cold upwelling is muted. A huge stretch of ocean surface warms, and it hands heat to the atmosphere through evaporation and rising air.
La Niña does the opposite. More cold water reaches the surface, the ocean takes up more heat, and the global average dips for a while. The mechanics of the two phases are explained in El Niño vs La Niña.
Neither phase adds or removes heat from the climate system overall. ENSO moves heat between the ocean and the air. The long-term rise comes from the greenhouse effect; El Niño and La Niña ride on top of it.
Why the record comes later
There is a delay. The warmth released by the Pacific takes months to spread through the global atmosphere, so the global temperature peak usually comes several months after the Pacific peak. El Niños tend to peak around December, which is why the calendar year after a strong El Niño often sets the record.
| Record year | El Niño behind it | What happened |
|---|---|---|
| 1998 | 1997-98 | Warmest year on record at the time |
| 2016 | 2015-16 | Warmest on record at the time; NASA estimated El Niño added about 0.12°C (0.2°F) |
| 2024 | 2023-24 | Warmest year on record, about 1.55°C above 1850-1900 (WMO) |
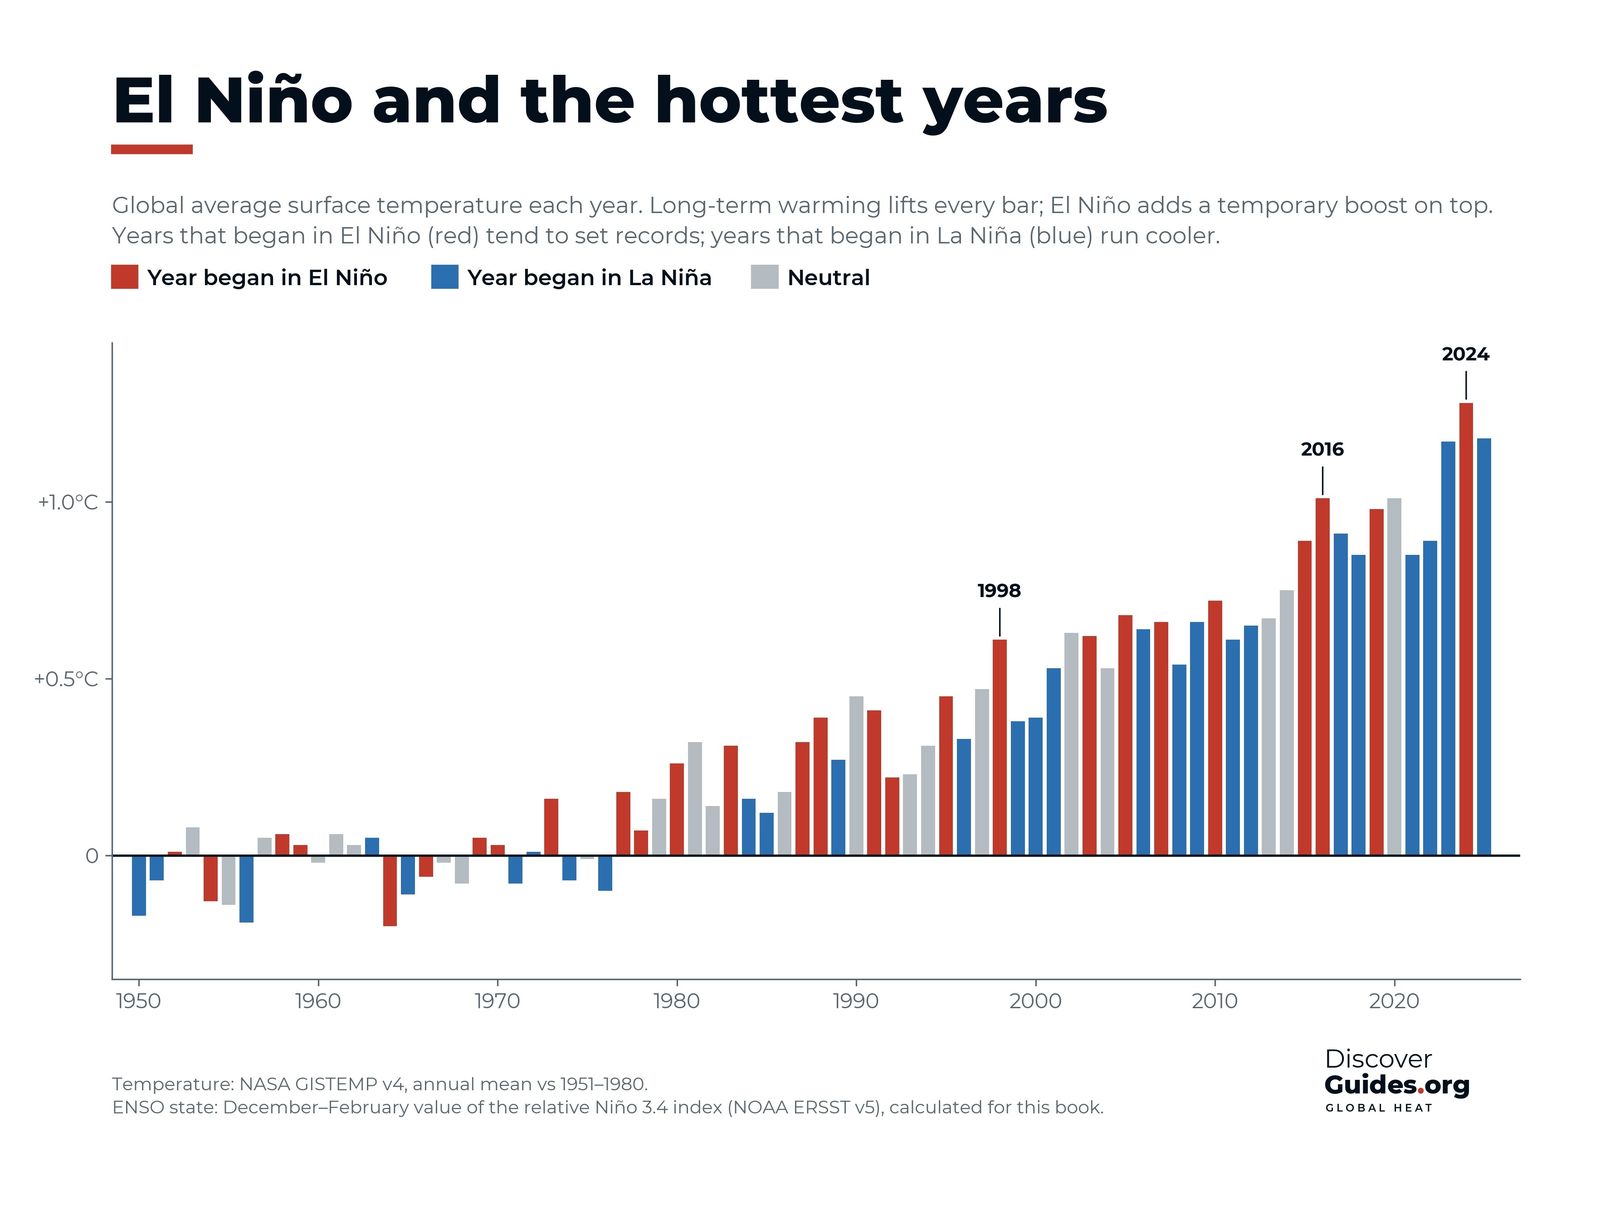
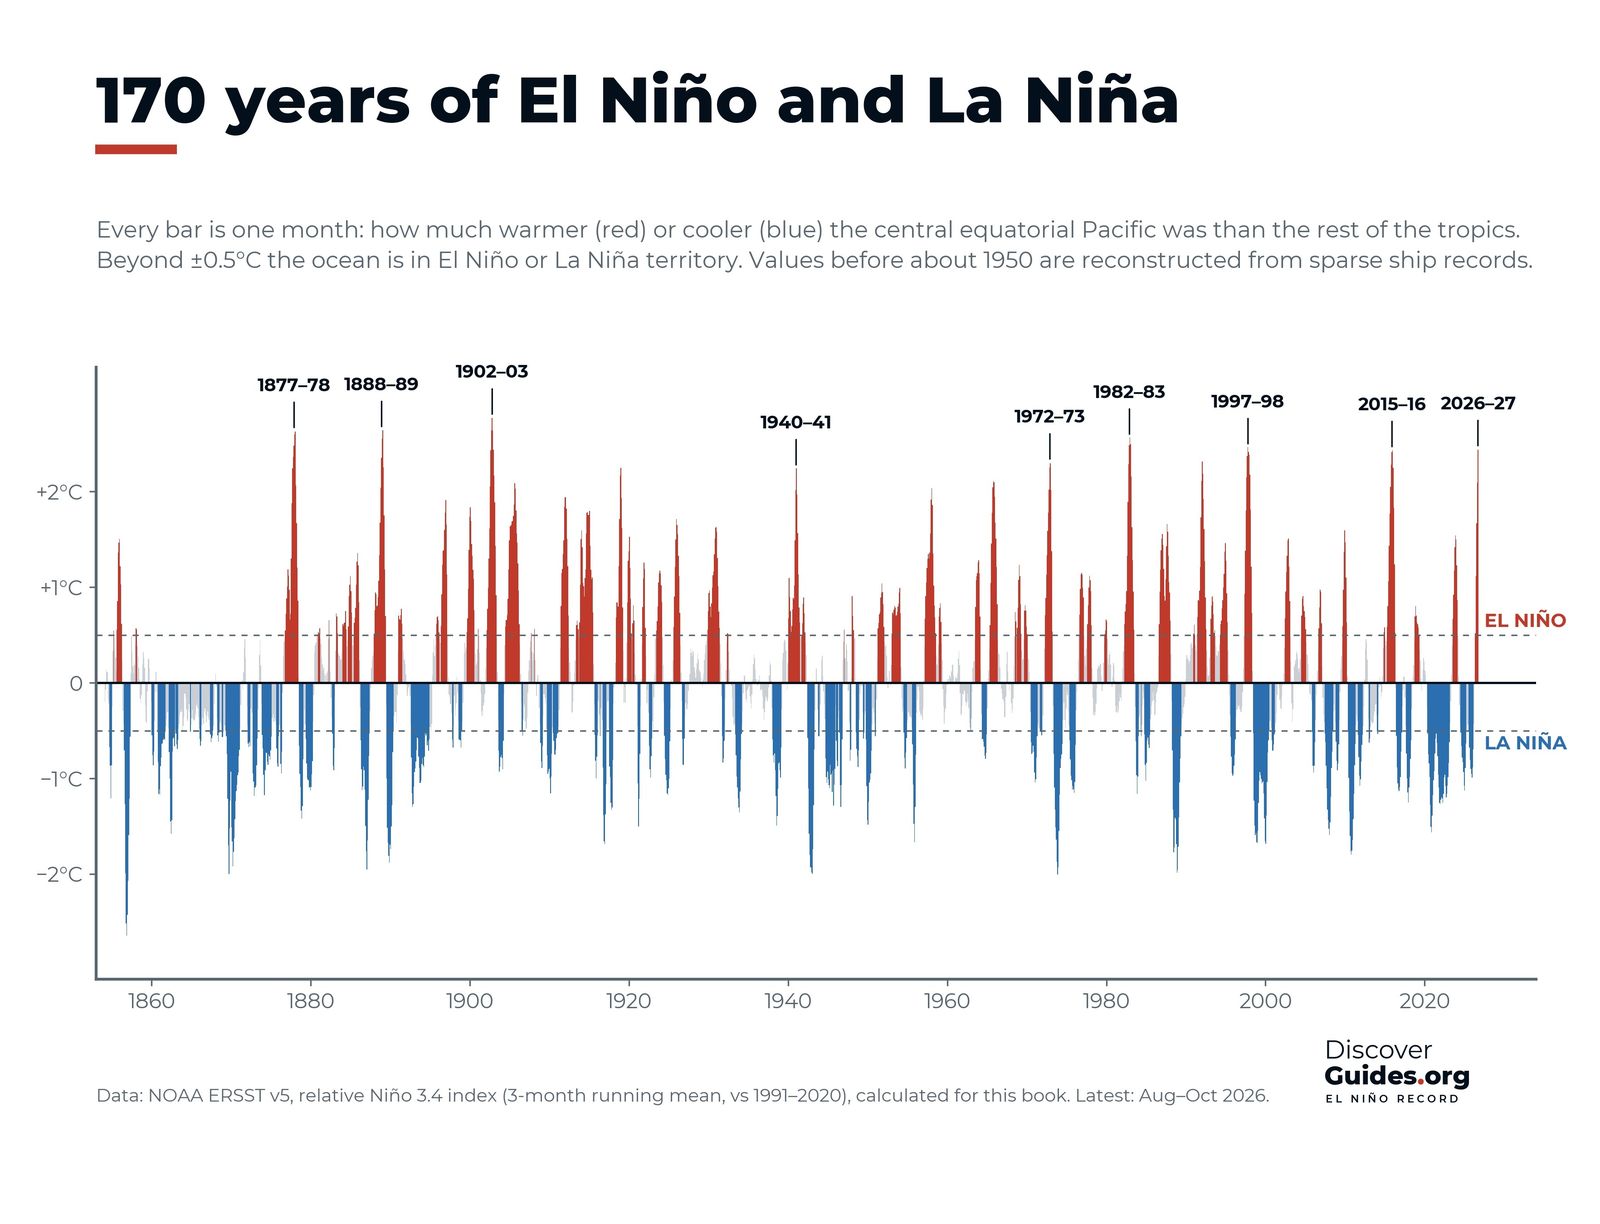
The chart at the top of this page shows the pattern since 1950, using NASA's temperature record. Years that began in El Niño (red) tend to stand above their neighbours, while years that began in La Niña (blue) run cooler. The steady climb of every bar, of every colour, is the warming trend.
The trend matters more than the wobble
El Niño's direct effect on a single year is measured in tenths of a degree. NASA estimated that El Niño added about 0.12°C (0.2°F) to the global temperature of 2016. That is enough to tip a year into first place, but small next to the warming of the past century.
The chart makes this clear. Recent La Niña years, which should be cool, are warmer than the El Niño record-breaker of 1998. In other words, a "cool" year today is hotter than a "hot" year a generation ago. According to the World Meteorological Organization, every one of the ten years to 2024 ranks among the ten warmest on record, and 2025, which began in La Niña, was among the three warmest.
Other forces in the mix
El Niño is not the only natural factor that moves global temperature from year to year. Large volcanic eruptions can cool the planet for a year or two by filling the stratosphere with reflective particles. The eruption of El Chichón in Mexico in 1982 coincided with the giant El Niño of 1982-83 and masked much of its warming, and the 1991 eruption of Mount Pinatubo in the Philippines cooled the following years. Smaller influences, such as the 11-year solar cycle and changes in air pollution, also play a part, which is why the link between El Niño and records is strong but not perfect.
2023-24: a warning shot
The 2023-24 El Niño was not one of the giants. By the book's relative index it peaked at about +1.5°C, well below 1997-98 or 2015-16. Yet it helped push 2024 to the warmest year on record, at about 1.55°C above the 1850-1900 average according to the WMO, likely the first calendar year above 1.5°C. Scientists are still studying why 2023 and 2024 ran quite so hot; El Niño was one factor among several. The full story is in El Niño 2023-24 and the Hottest Year on Record.
A single year above 1.5°C does not mean the Paris Agreement limit has been breached. That limit refers to warming averaged over about twenty years. But each El Niño now lifts the planet into territory that the long-term trend will reach permanently soon after.
What a 2026-27 super El Niño could mean
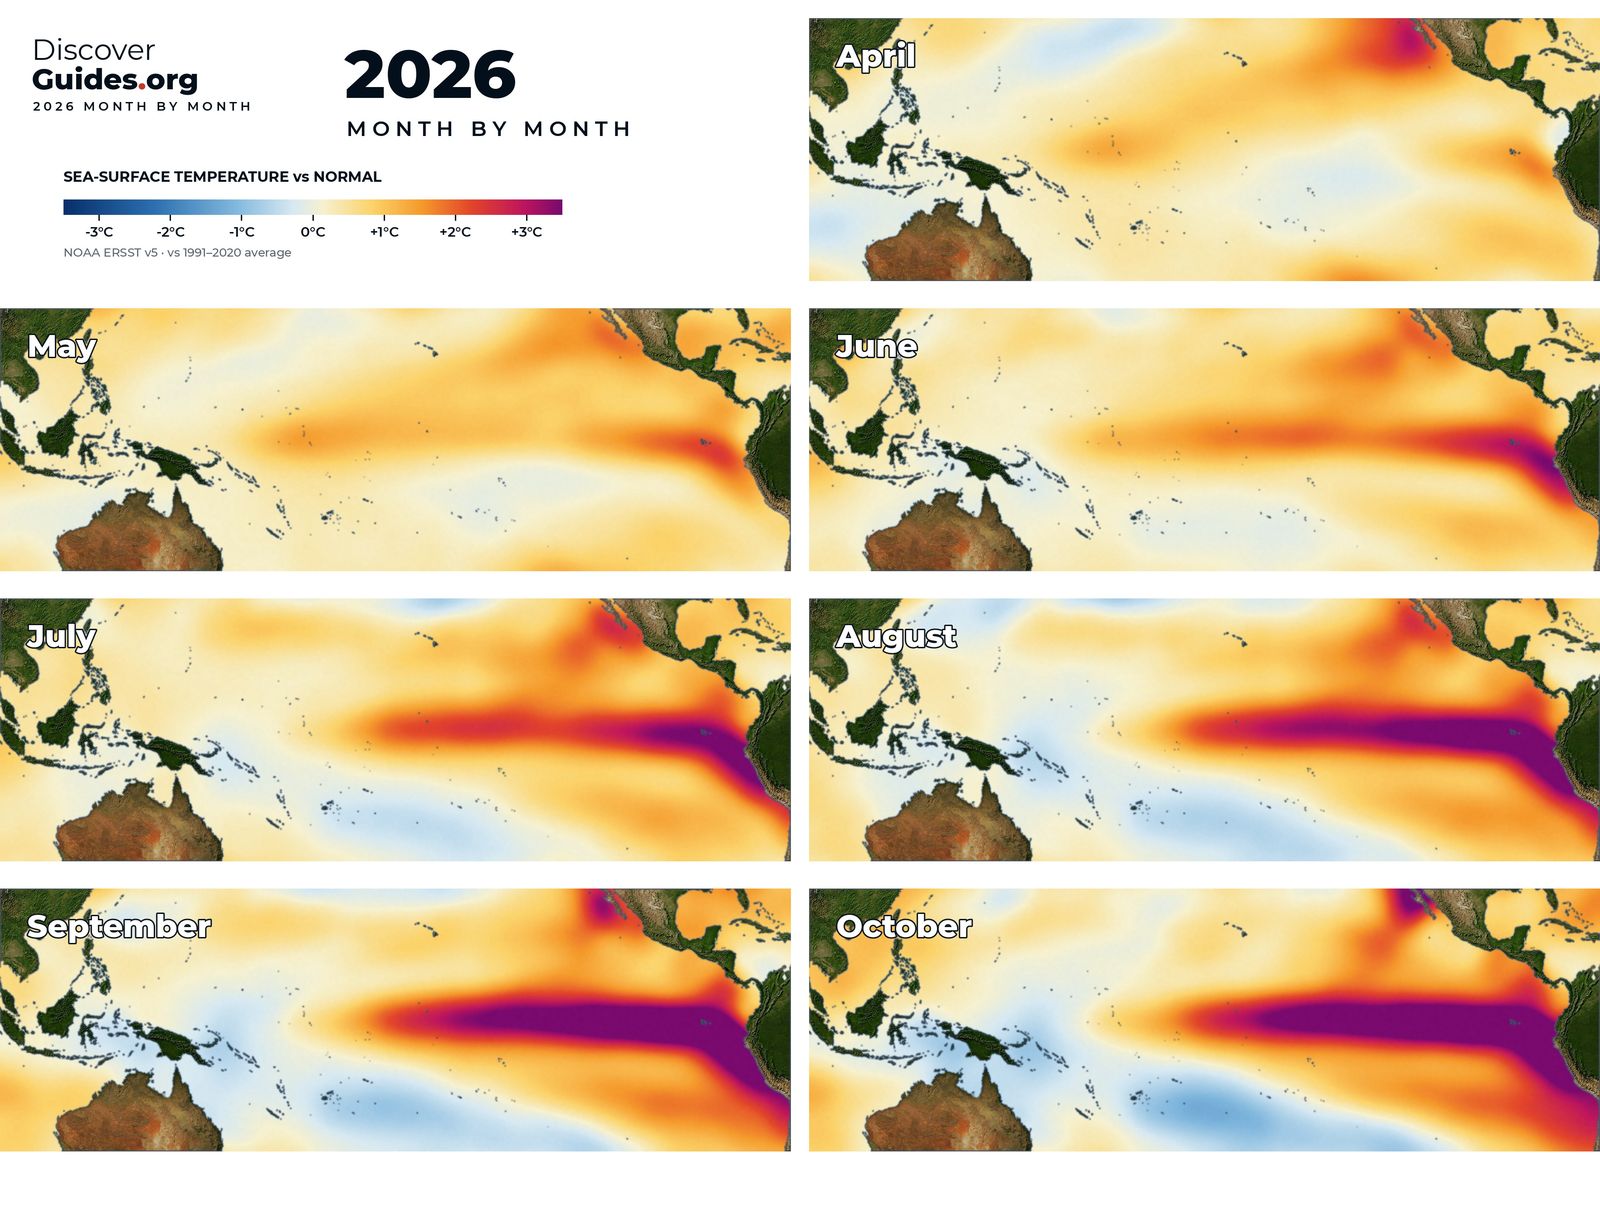
As of NOAA's October 2026 update, a strong-to-very strong El Niño is likely through January-March 2027, with a high chance of a historic event. Because global temperature lags the Pacific by several months, an El Niño that peaks around the end of 2026 would have its largest effect in 2027. The WMO's Secretary-General has said it would not be surprising if the 2024 record were broken. Whether that happens will depend on the event's final strength and on everything else the climate does, so it should be treated as a real possibility, not a certainty. The current event is tracked in The 2026-27 Super El Niño.
SafetyHeat during El Niño years is dangerous. Strong events raise the odds of heatwaves in many tropical and subtropical regions. Follow local heat warnings, drink water, avoid strenuous activity in the hottest hours, and check on older people and others at risk.
For how El Niño reshapes regional weather, see What El Niño Means for Weather Around the World. The heat chapter of Discover El Niño charts every record year since the 19th century against the state of the Pacific.
Questions
Does El Niño cause global warming?
No. El Niño moves heat from the ocean to the atmosphere and lifts global temperature for a while, but it does not add heat to the climate system. The long-term warming comes from greenhouse gases.
How much does El Niño raise global temperature?
Typically by about a tenth to a few tenths of a degree Celsius for a year. NASA estimated that El Niño added about 0.12°C (0.2°F) to global temperature in 2016.
Why are the hottest years often after an El Niño?
Global temperature peaks several months after the Pacific. Because El Niños usually peak around December, the following calendar year often feels the full effect, as in 1998, 2016 and 2024.
Will the 2026-27 El Niño make 2027 the hottest year on record?
It is possible. As of NOAA's October 2026 update the El Niño was very strong and expected to peak around the end of 2026, which would put its largest effect in 2027. The WMO has said a new record would not be surprising, but it is not certain.