At a glance
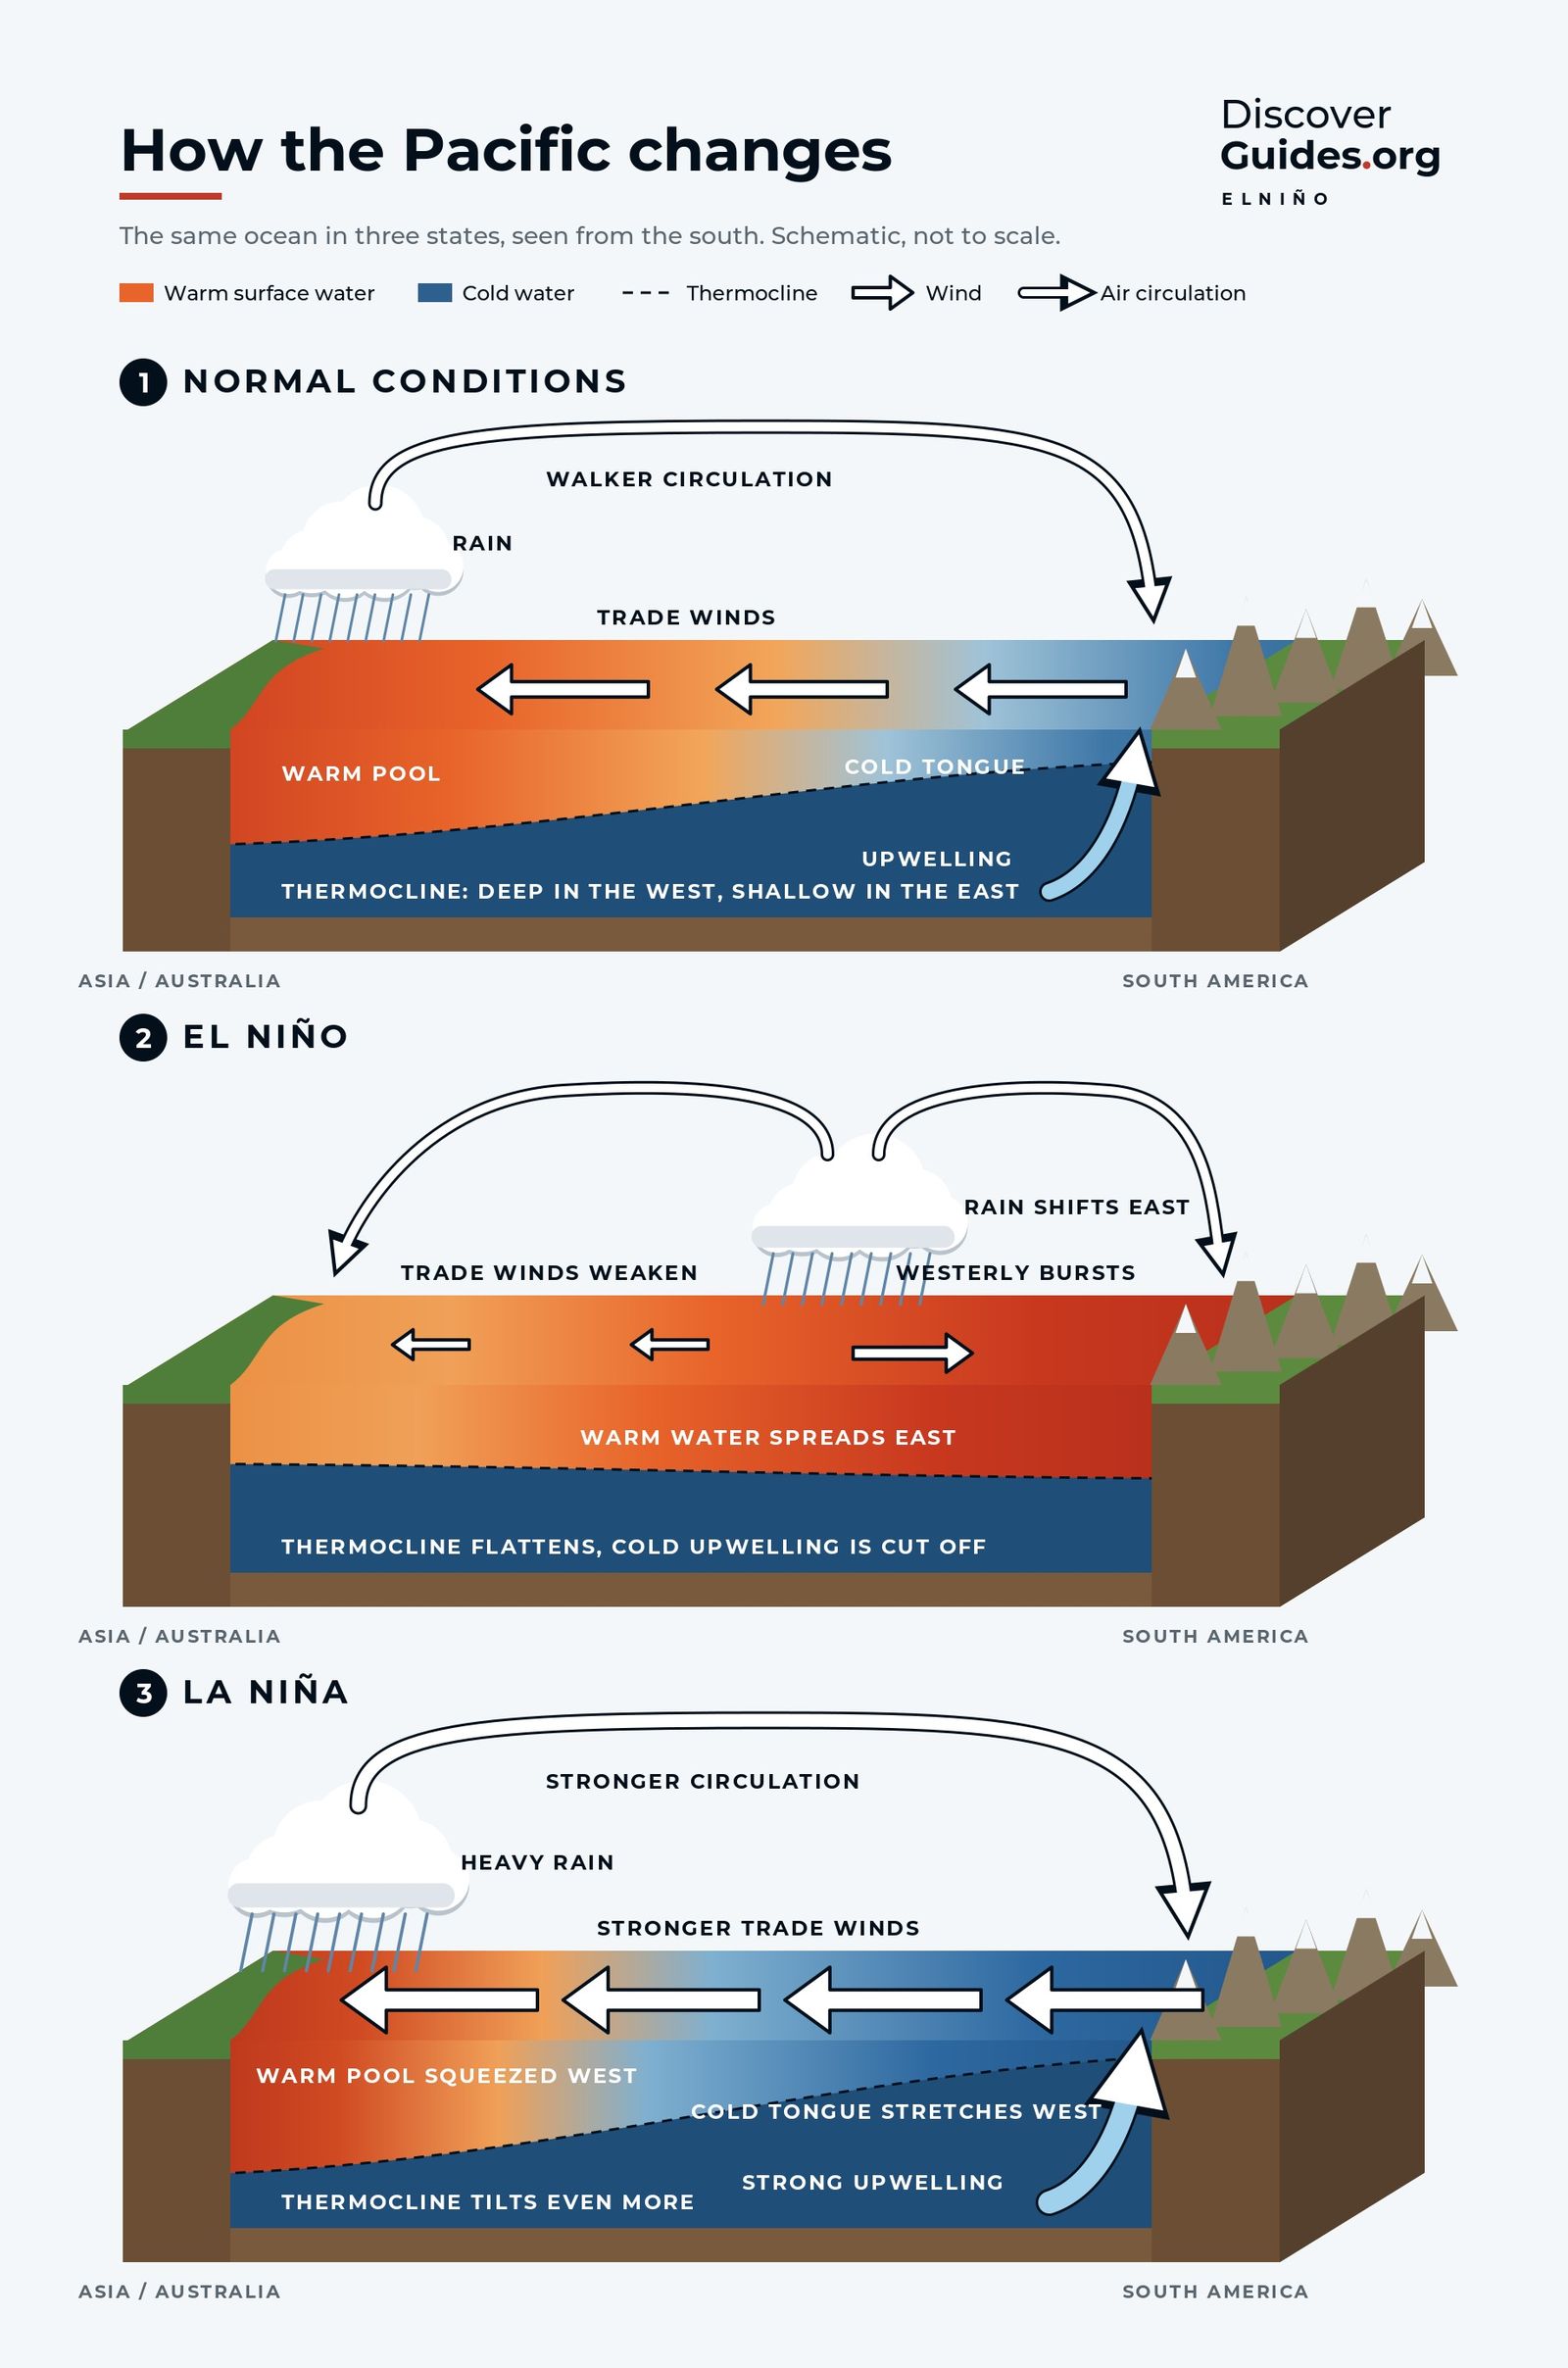
El Niño moves the Pacific's largest thunderstorms from the area around Indonesia towards the central and eastern Pacific. Those storms are among the biggest heat sources in the atmosphere, so moving them bends the jet streams and shifts storm tracks around the planet. These long-distance links are called teleconnections, and the jet streams are the main messengers.
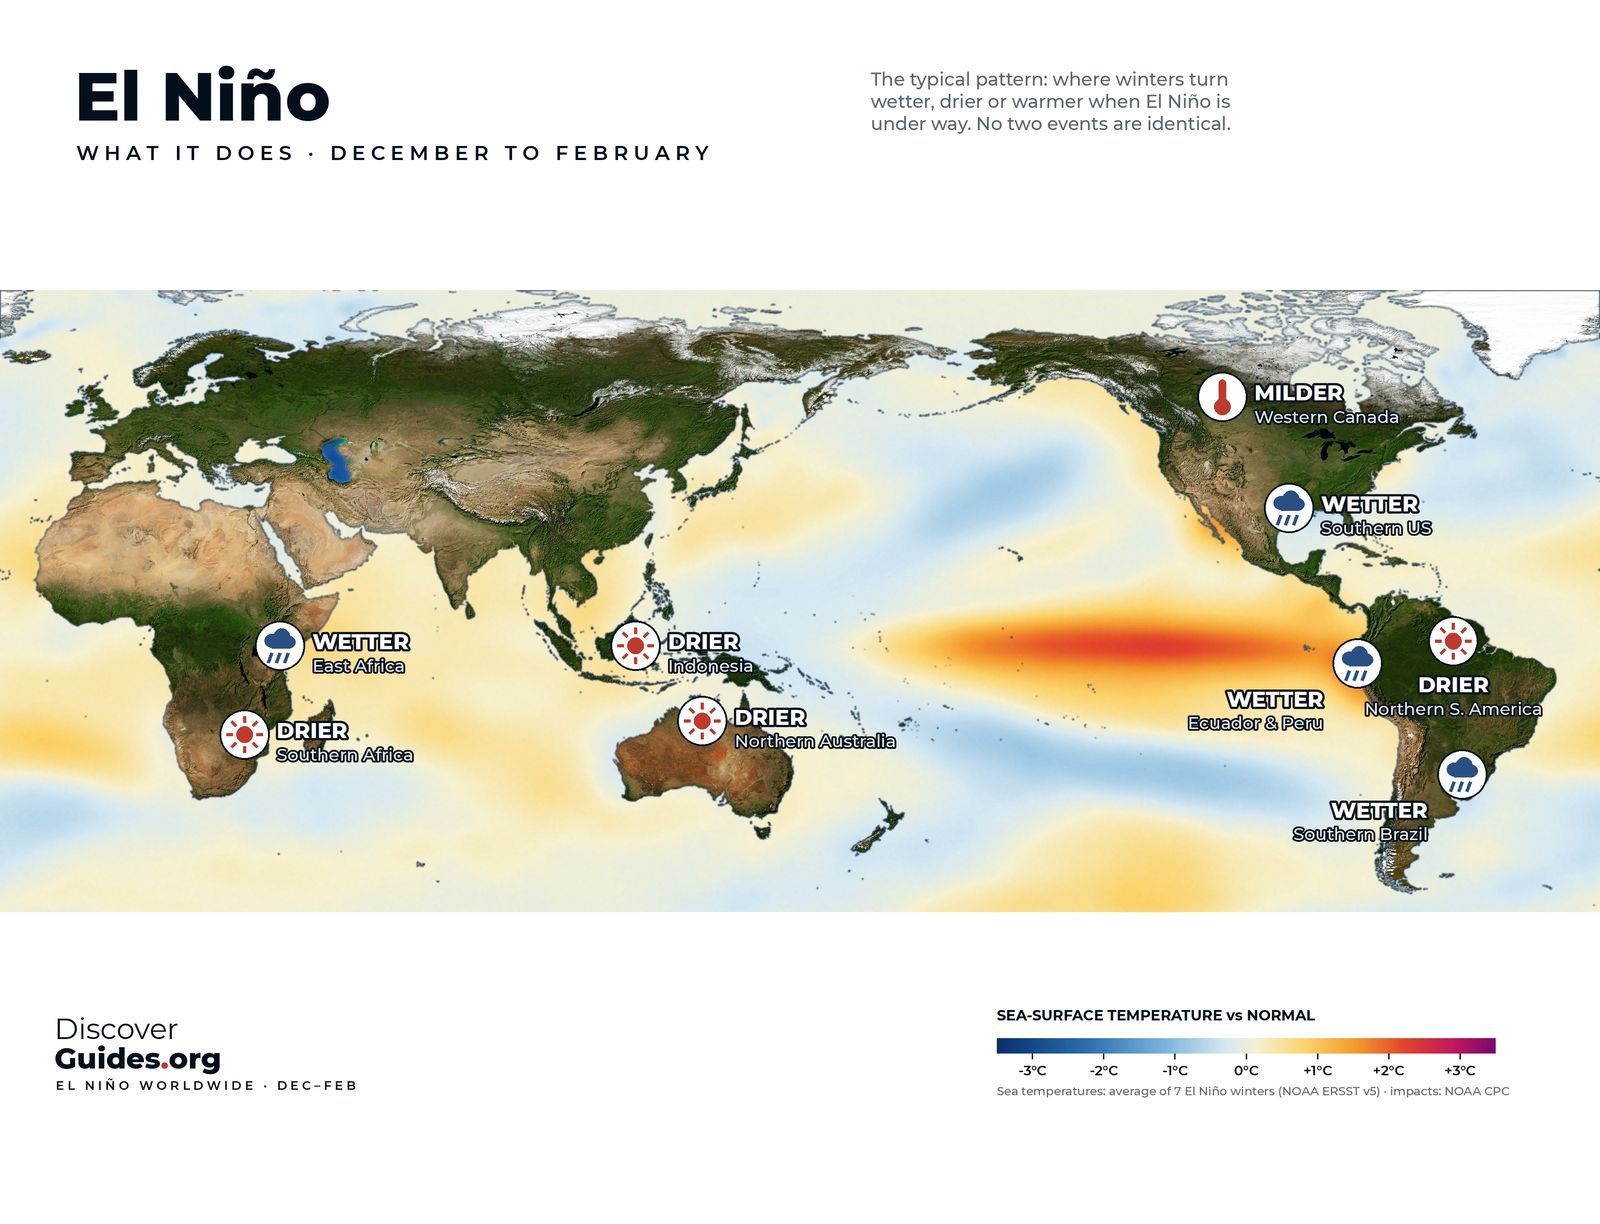
The effects depend heavily on the season. The map at the top of this page shows the typical pattern for December to February, when most El Niños peak; the map further down shows June to August.
December to February: the peak season
This is when El Niño's influence is broadest, because the event is usually at its strongest and the Northern Hemisphere jet streams are at their most powerful.
- Southern United States: often wetter and stormier, from California across the Gulf Coast to Florida, as a strengthened Pacific jet steers storms south. See El Niño and California.
- Western Canada and the northern United States: often milder than normal.
- Ecuador and northern Peru: heavy rain on a normally dry coast, with warm seas offshore. See El Niño in Peru.
- Southern Brazil, Uruguay and north-east Argentina: often wetter.
- Northern South America: often drier, including parts of Colombia, Venezuela and northern Brazil.
- Indonesia and northern Australia: often drier, with a higher risk of drought and fire.
- Southern Africa: often drier during its main rainy season, a serious risk for maize harvests.
- East Africa: often wetter, especially in the October to December short rains.
June to August: the growing season
In the northern summer an El Niño is usually still building, but it already reaches far beyond the Pacific.
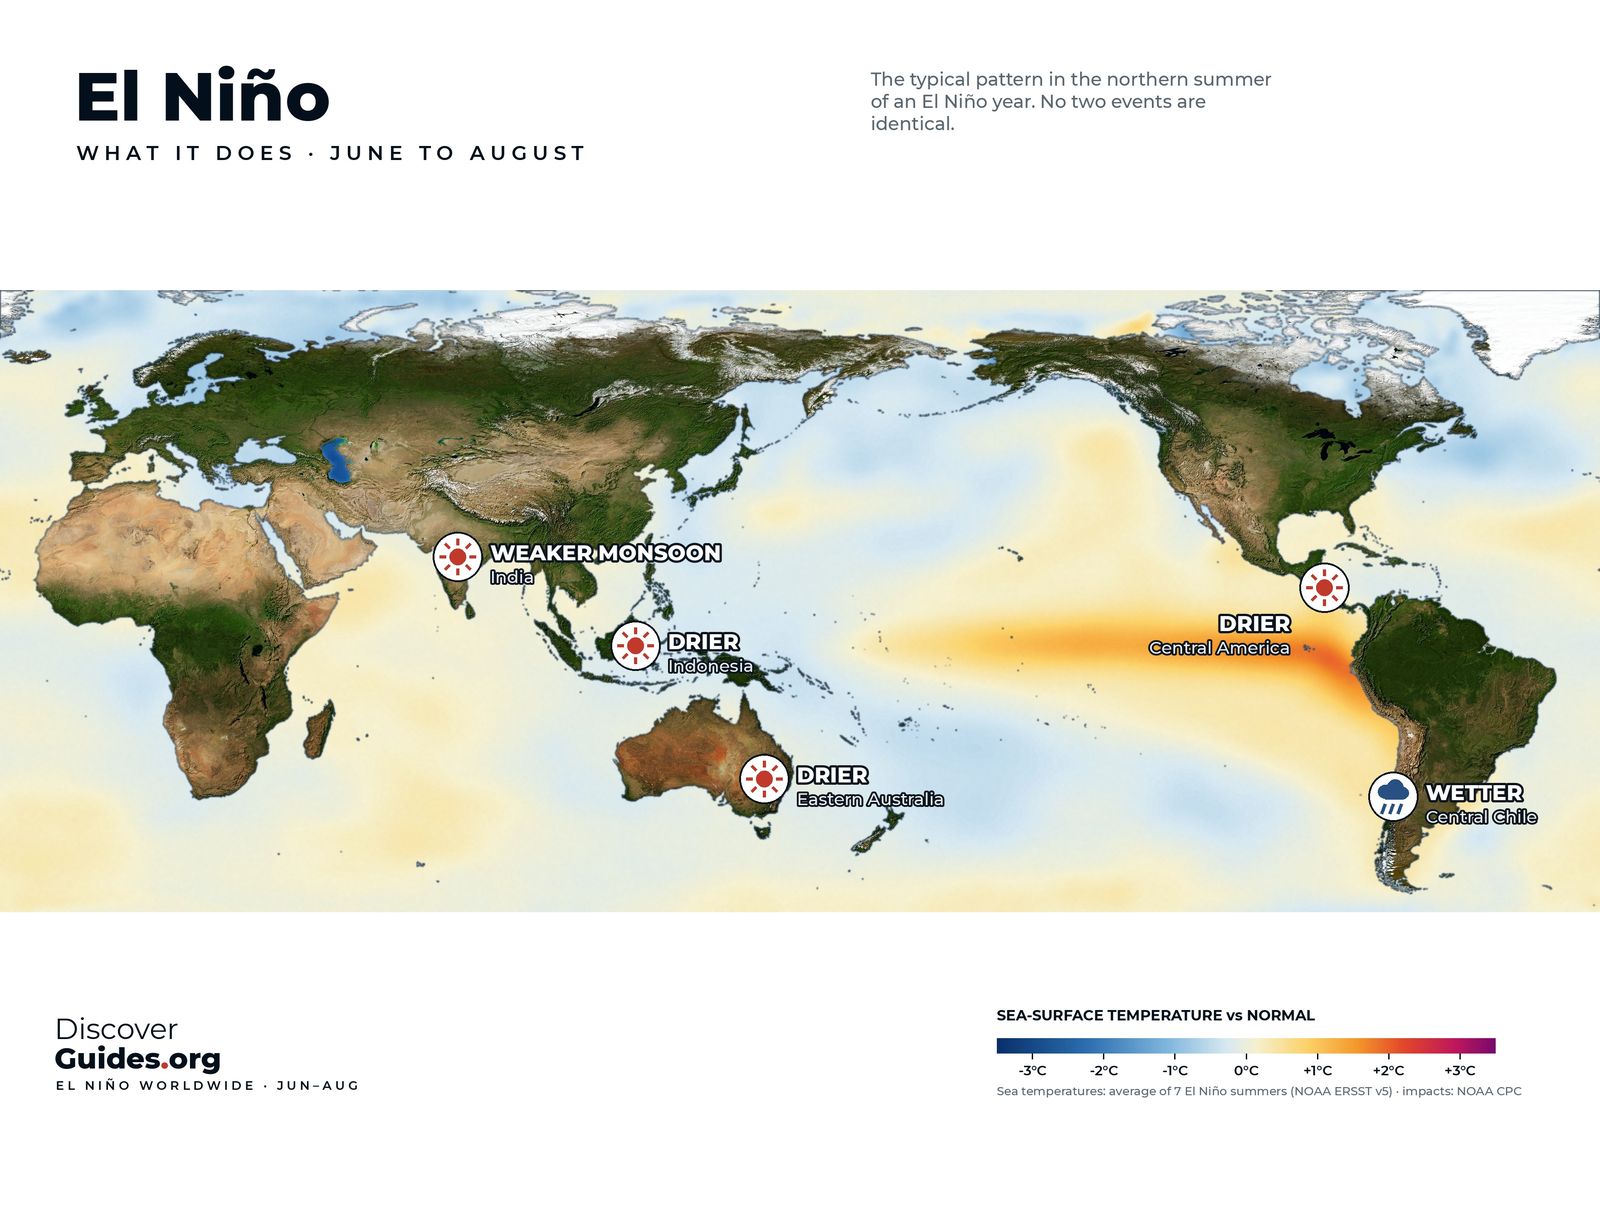
- India: the summer monsoon is often weaker. Not always: the very strong 1997 event came with a near-normal monsoon, a reminder that the Indian Ocean has its own patterns.
- Indonesia: often drier, with a longer dry season. Peat and forest fires are a major risk in strong events.
- Eastern Australia: often drier in winter and spring, raising the risk of drought and an early fire season.
- Central America: often drier in the main rainy season, a key concern for farmers in the region's "dry corridor".
- Central Chile: often wetter in its winter.
| Region | December-February | June-August |
|---|---|---|
| Indonesia | Drier | Drier |
| Australia | Drier in the north | Drier in the east |
| India | Small signal | Weaker monsoon |
| Southern Africa | Drier | Dry season |
| Southern United States | Wetter, stormier | Small signal |
| Ecuador and Peru coast | Wetter | Warm seas building |
Tropical storms move too
El Niño also reshuffles hurricane and typhoon seasons. In the Atlantic, stronger upper-level winds increase the wind shear that tears developing storms apart, so El Niño years usually have fewer hurricanes. In the central and eastern Pacific, warmer water tends to favour more and stronger storms. In the western North Pacific, typhoons often form further east and can grow longer-lived. The details are in El Niño, Hurricanes and Typhoons.
Strong events, bigger stakes
The strongest El Niños show how far the effects can reach. During the 2015-16 event, drought in Indonesia helped fuel widespread peat and forest fires, and smoke haze spread across parts of South-East Asia. In 1997-98, the coast of Ecuador and northern Peru saw devastating floods, while East Africa had exceptional rains in its short rainy season, helped by a strong Indian Ocean Dipole at the same time.
Why no two El Niños are alike
Each map shows the typical pattern, based on many past events. Real El Niños differ for several reasons:
- Where the warmth sits. Some events peak in the eastern Pacific, others in the central Pacific, and the shifted thunderstorms then sit in different places.
- Other climate patterns. The Indian Ocean Dipole, the Atlantic and the Arctic all push the weather too, sometimes against El Niño.
- Strength is not impact. The World Meteorological Organization stresses that the strength of an El Niño does not translate directly into the size of its impacts in any one region.
- Ordinary weather. A single storm or blocking high can overwhelm a seasonal tendency.
Global warming adds a layer on top. El Niño also lifts global average temperature for a while, so heatwaves during and after an event happen against a warmer background than ever before.
SafetyEl Niño raises the odds of floods, landslides, drought, wildfire and heatwaves in many regions. A seasonal outlook is not a weather warning. Follow your national weather service and local emergency authorities for warnings that apply to where you are.
What it means in 2026-27
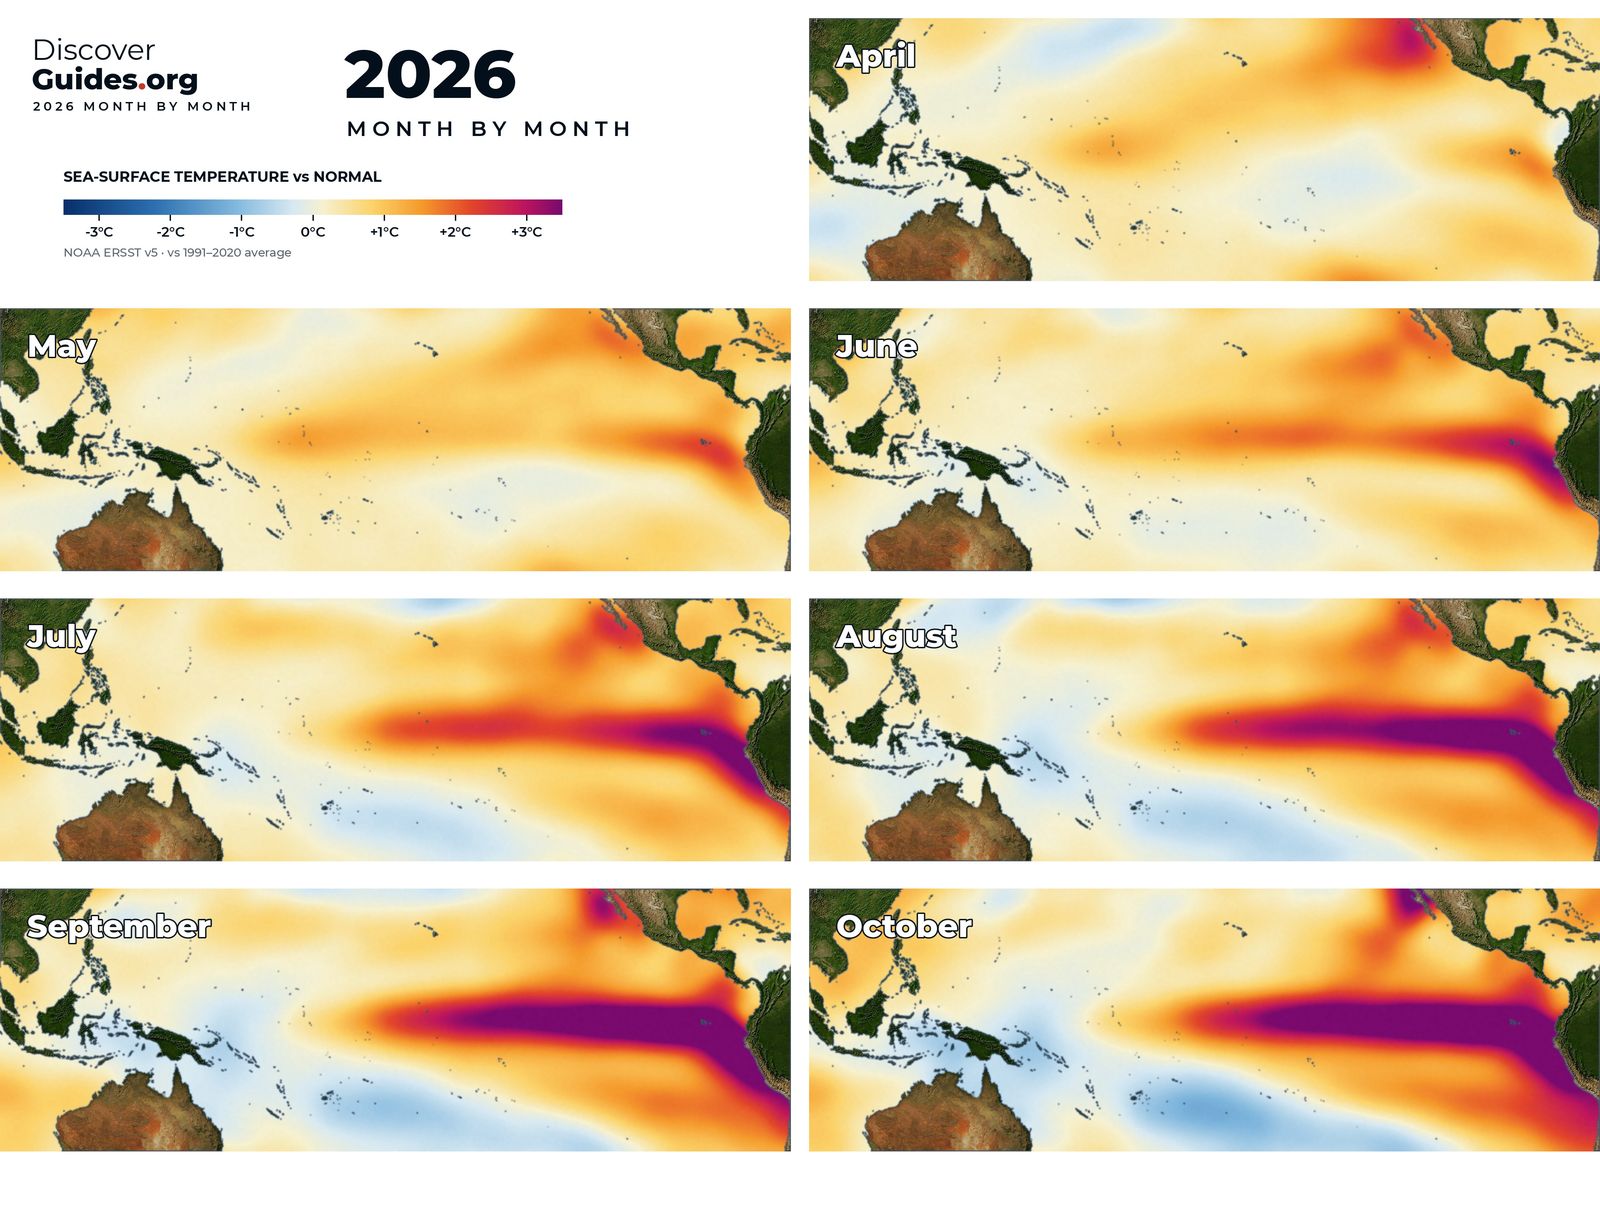
As of NOAA's October 2026 update, a strong-to-very strong El Niño is likely through January-March 2027, so the December-February pattern above is the one to watch this winter. National weather services already build El Niño into their seasonal outlooks, and those outlooks are the best guide for a specific place. The current event is tracked in The 2026-27 Super El Niño, and the region-by-region chapters of Discover El Niño cover each pattern in depth.
Questions
Which countries are affected by El Niño?
Many. In a typical El Niño winter (December-February), Indonesia, northern Australia, southern Africa and northern South America tend to be drier; Ecuador, Peru, the southern United States, south-eastern South America and East Africa tend to be wetter; western Canada tends to be milder.
Does El Niño cause drought?
It raises the risk of drought in several regions, including Indonesia, eastern Australia, southern Africa, Central America and India during the monsoon. It does not guarantee drought in any one place.
How does El Niño affect India?
El Niño years often bring a weaker summer monsoon in India, but not always. The very strong El Niño of 1997 came with a near-normal monsoon.
How does El Niño affect Europe?
Only weakly and inconsistently. Other patterns, such as the North Atlantic Oscillation, usually matter more for European weather.