At a glance
The month-by-month climb
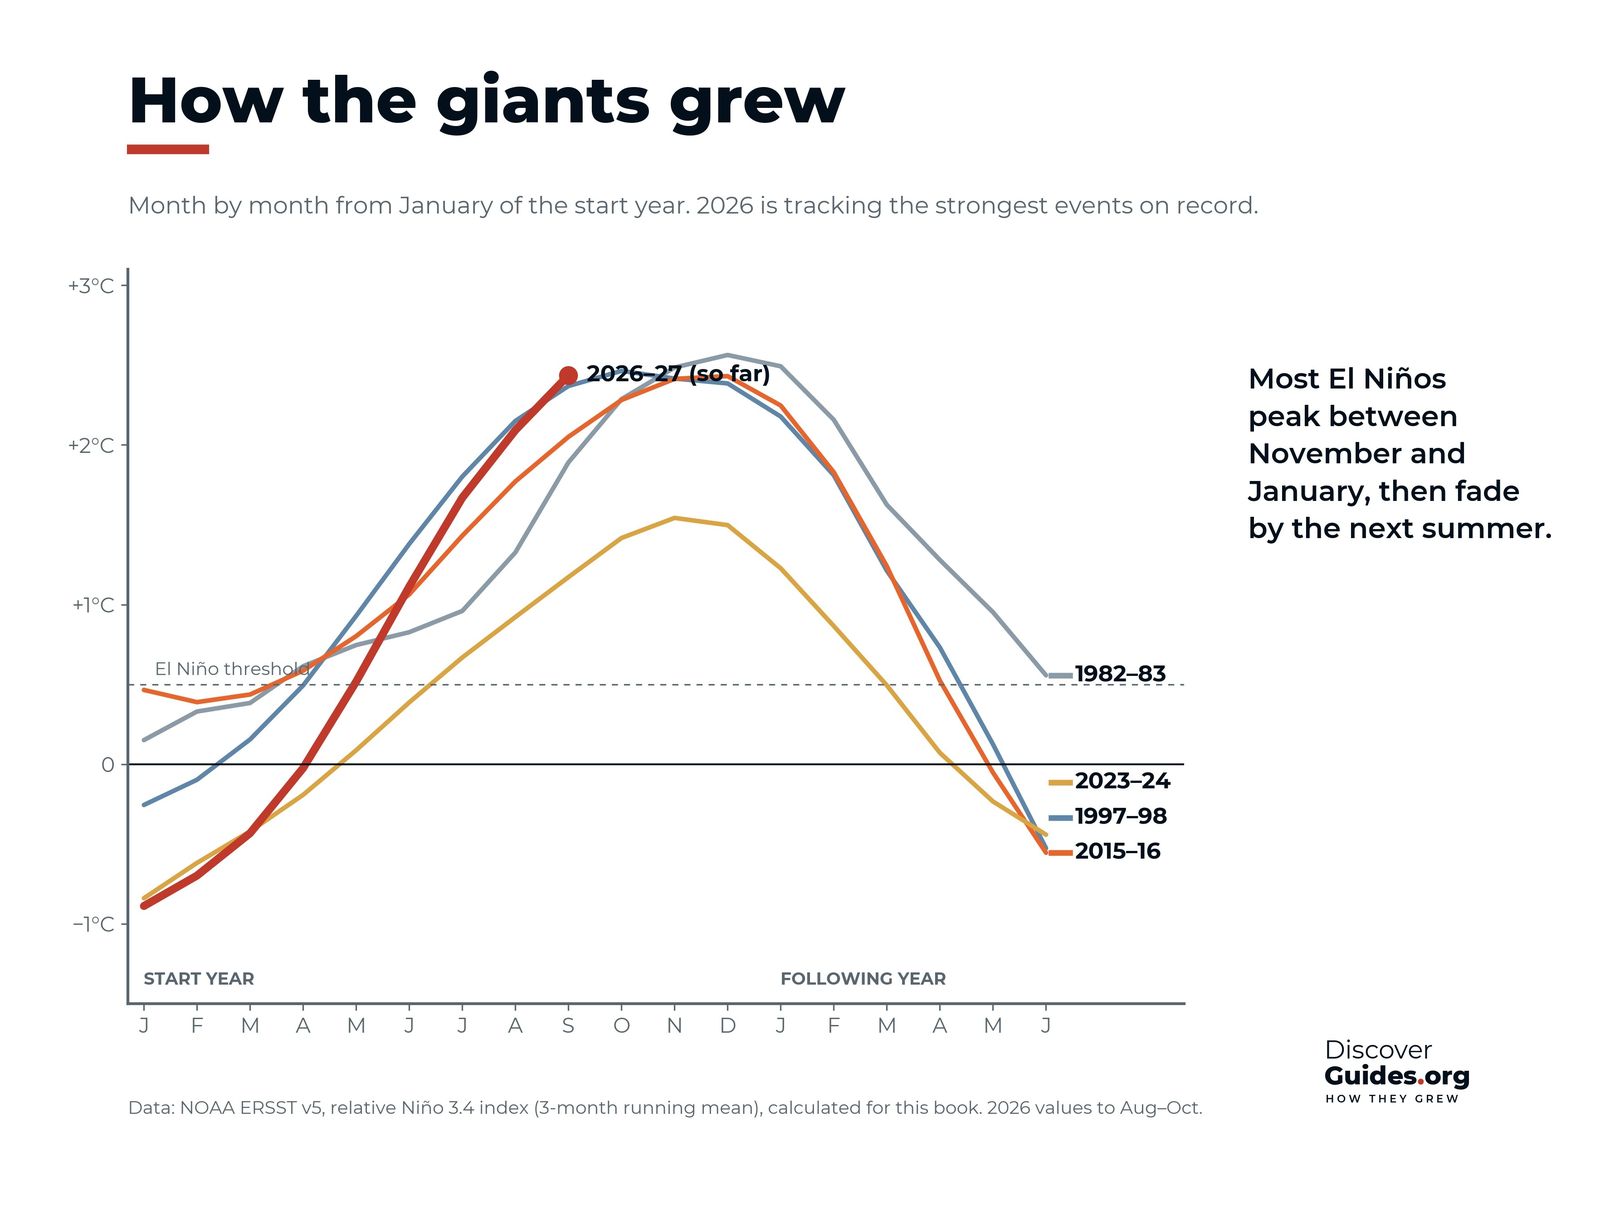
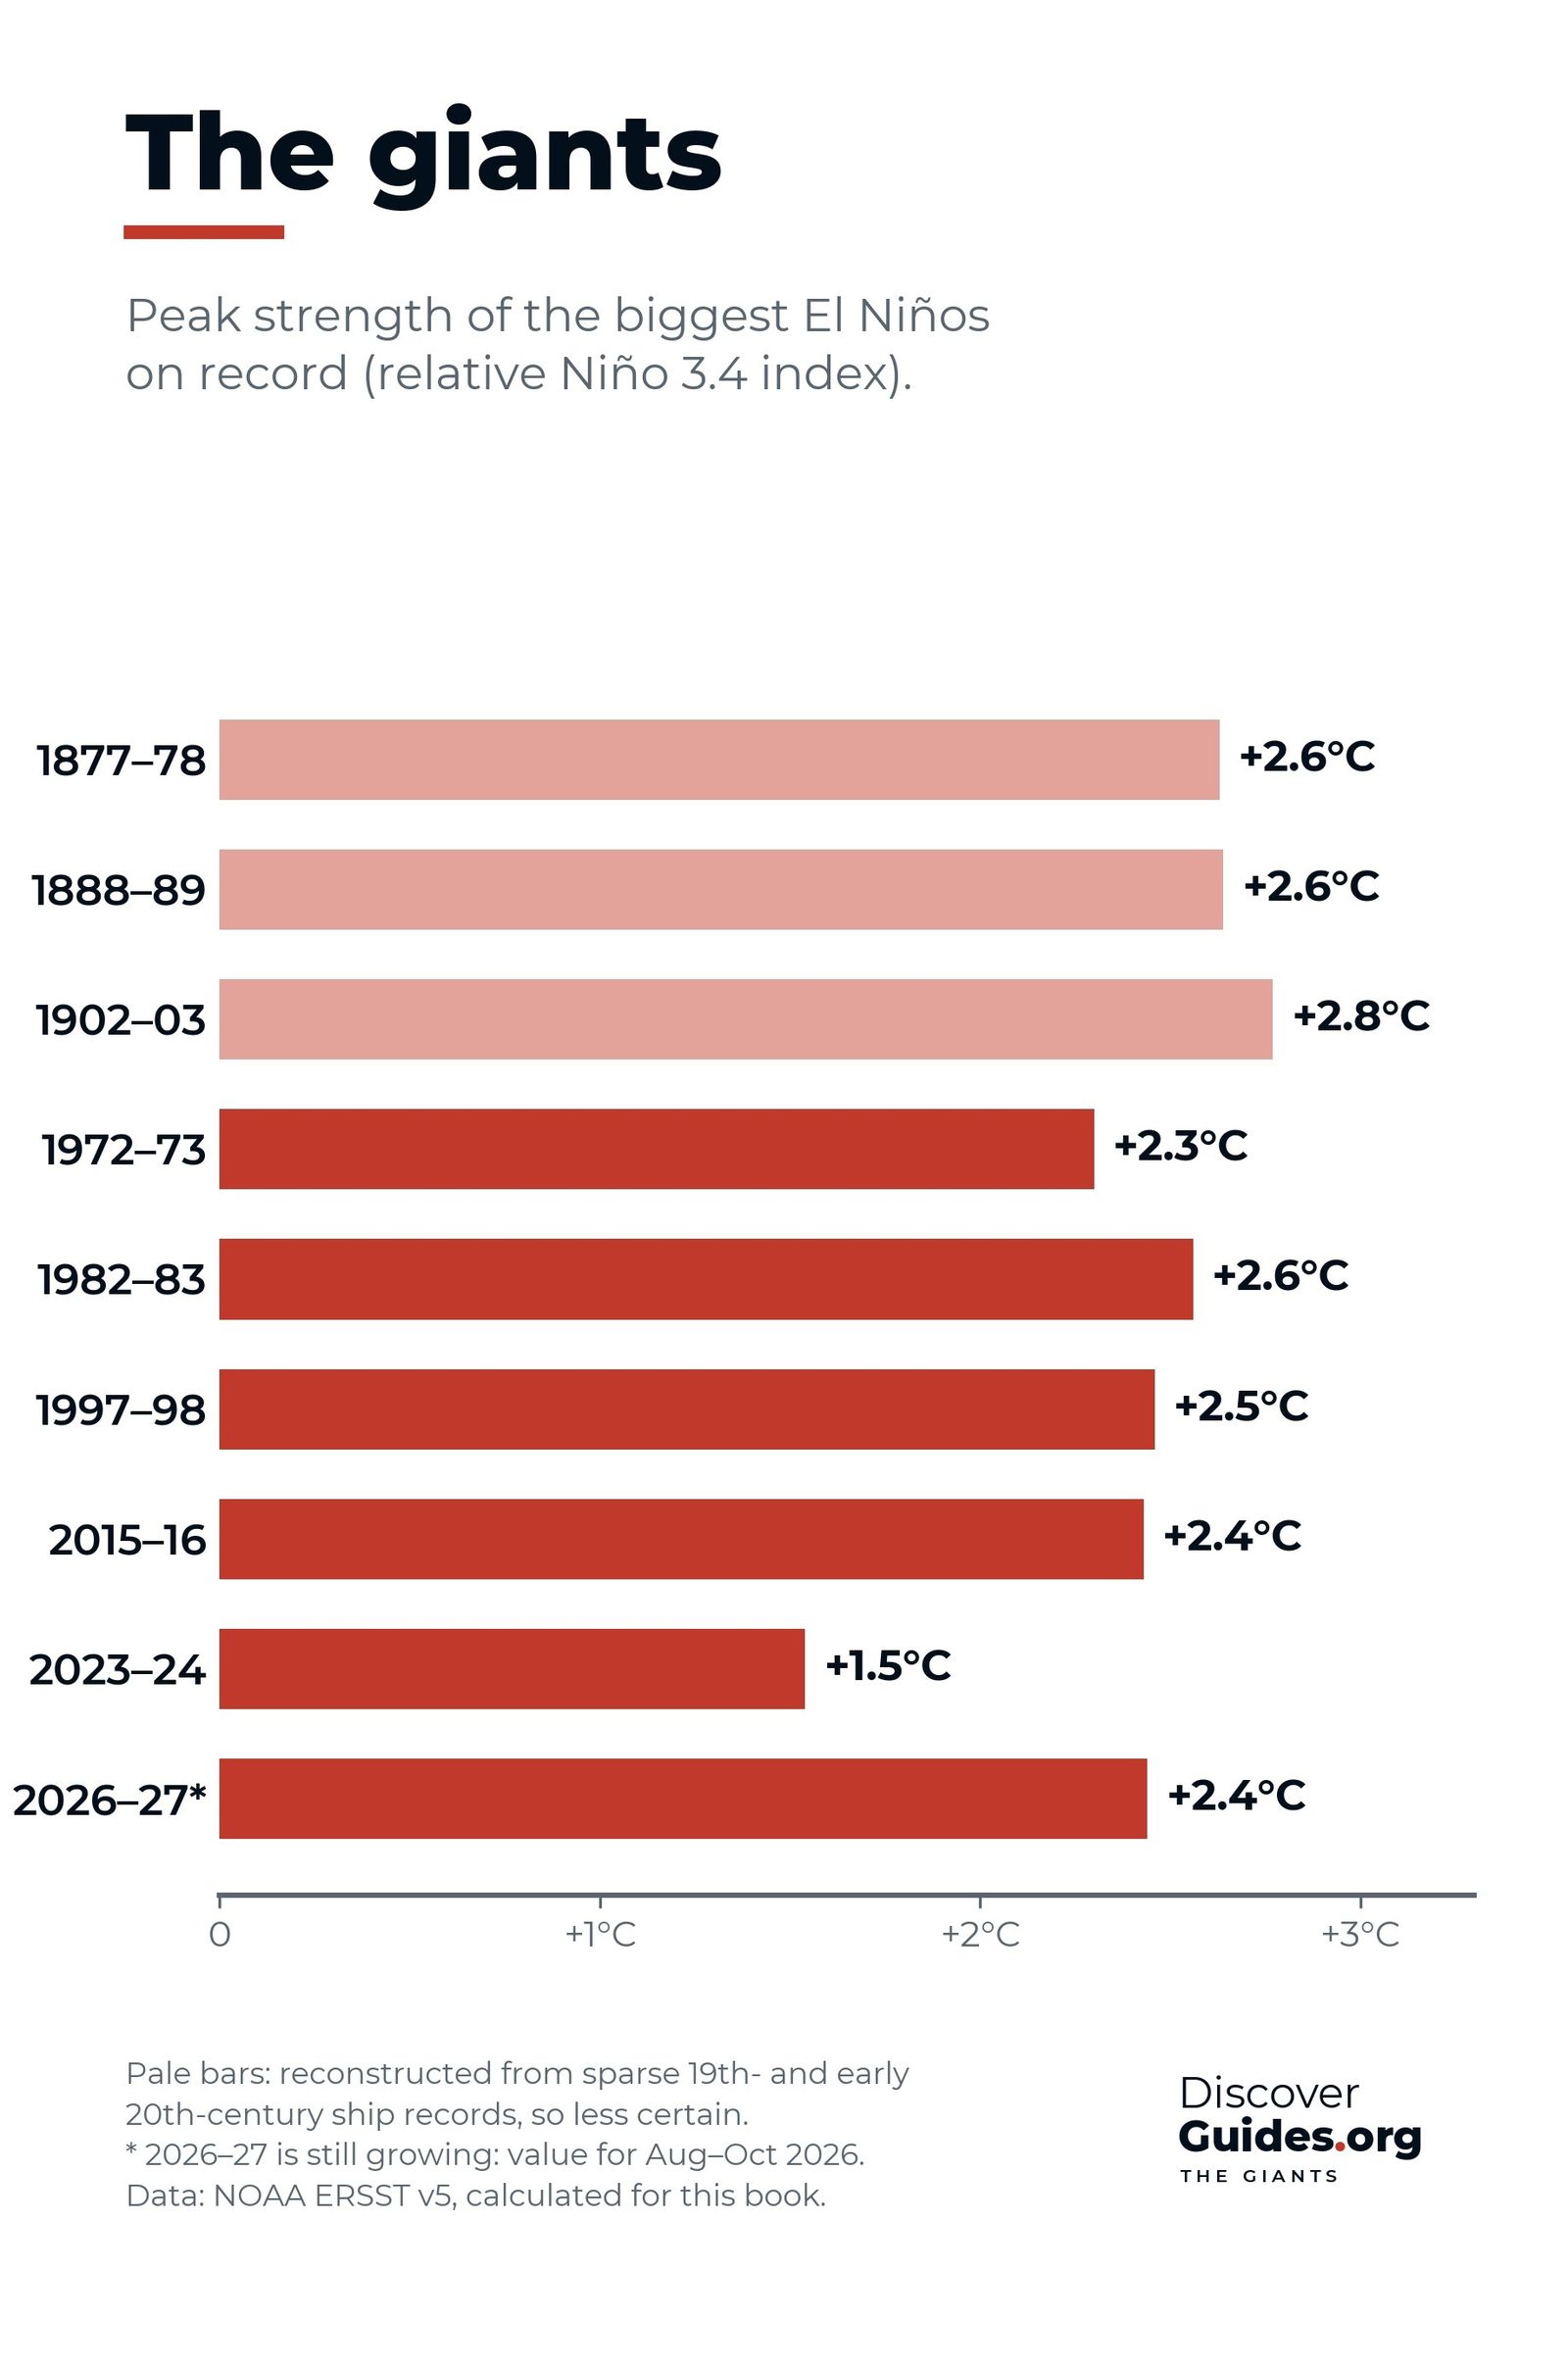
NOAA's Oceanic Niño Index shows how alike the giants were in shape. The chart at the top of this page, built from NOAA's ERSST sea-temperature record, compares how each gathered strength through the northern autumn.
| Season | 1982-83 | 1997-98 |
|---|---|---|
| Jun-Aug (start year) | +0.8 | +1.5 |
| Sep-Nov | +1.8 | +2.2 |
| Nov-Jan (peak) | +2.1 | +2.4 |
| Feb-Apr | +1.5 | +1.4 |
| May-Jul | +0.6 | −0.1 |
| Sep-Nov (year after) | −0.8 | −1.1 |
Three-month running means of the Oceanic Niño Index, °C. Source: NOAA CPC (ERSST v6), accessed November 2026.
Ingredient 1: a loaded Pacific
A giant needs fuel: heat stored below the surface of the western Pacific. Before 1997-98, heat had built in the west for 12 to 18 months under strong trade winds. Before 2026-27, the weak La Niña of 2025-26 kept piling warm water at depth, and by early June 2026 the WMO reported subsurface temperatures more than 6 °C above average (see How Long Does El Niño Last?).
Ingredient 2: winds that keep blowing the wrong way
In 1997 a series of increasingly strong westerly wind bursts sent Kelvin waves across the Pacific, pushing the eastern thermocline down by more than 90 metres. In April 2026 NOAA put the chance of a very strong El Niño by winter at only about one in four, adding that it depended on westerly wind anomalies continuing through the northern summer. They did, and by August the chance had passed 90 per cent (see Kelvin Waves Explained).
Ingredient 3: the autumn surge
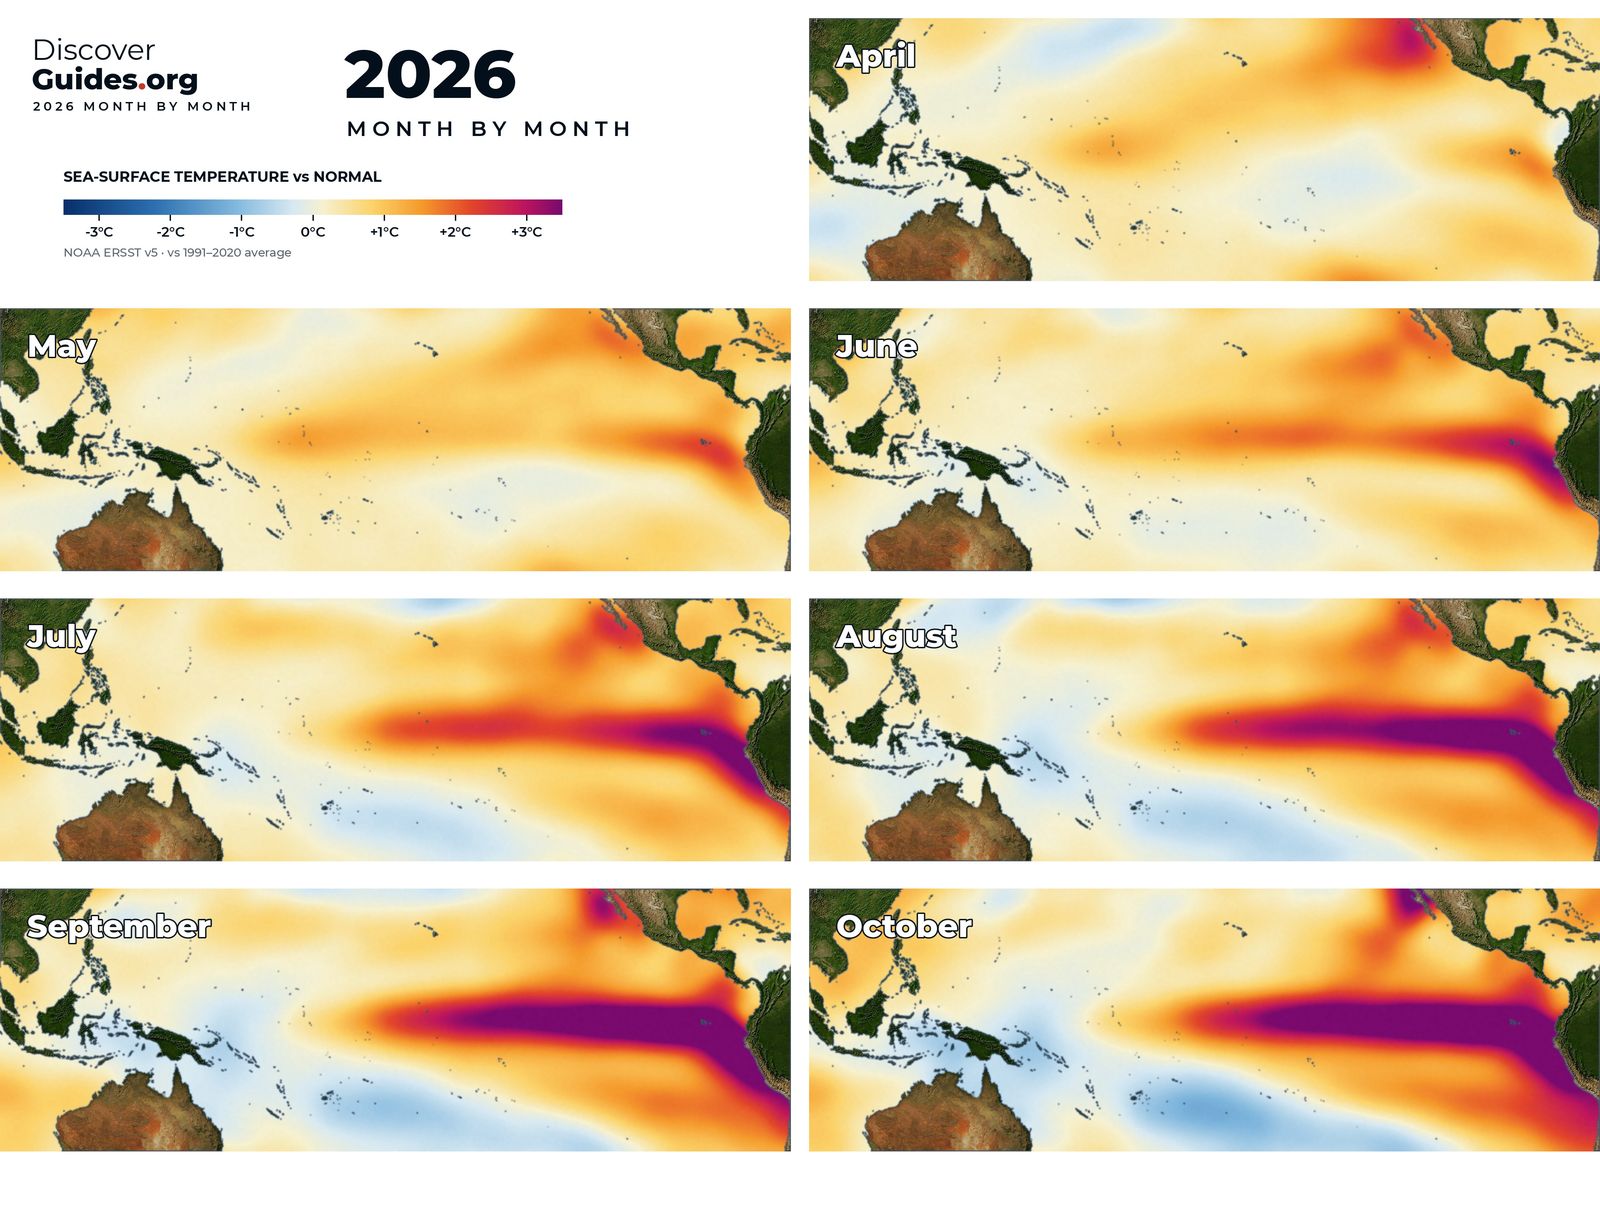
Once ocean and air lock together through the Bjerknes feedback, the event grows month by month, fastest in the northern autumn when the Pacific favours coupling. In 1997 every month from June to December set a new sea temperature record in the eastern equatorial Pacific, and by December anomalies across the cold tongue averaged nearly 4 °C. In 2026 the Niño 3.4 region reached 29.70 °C in September, its highest monthly temperature ever recorded and above the peaks of 1982-83, 1997-98 and 2015-16.
The giants side by side
| Event | Peak ONI | Peak RONI |
|---|---|---|
| 1972-73 | +1.8 °C | +2.0 °C |
| 1982-83 | +2.1 °C | +2.4 °C |
| 1997-98 | +2.4 °C | +2.3 °C |
| 2015-16 | +2.6 °C | +2.3 °C |
| 2023-24 | +2.0 °C | +1.4 °C |
| 2026-27 (so far) | +2.5 °C, Aug-Oct 2026 (preliminary) | +2.0 °C, Aug-Oct 2026 |
As of NOAA's 8 October 2026 discussion, the chance that 2026-27 becomes historic, with a three-month RONI of +2.5 °C or more, stood at 83 per cent for October-December. Columbia University's IRI reported that all 27 models in its October plume showed a very strong El Niño through December-February (see The 2026-27 Super El Niño).
The fall
Giants fall fast. By late 1983 the ONI stood at −0.8 °C, and by the end of 1998 it had fallen to −1.5 °C, deep in La Niña territory. In May 1998 the sea at 0°, 125°W cooled by 8 °C in 30 days. All three strong El Niños since 1950 in NOAA's 2016 analysis were followed by La Niña. The full ranking is in The Strongest El Niños in History.
Questions
What makes a super El Niño?
A large store of heat below the western Pacific, westerly winds that keep pushing it east through the northern summer, and strong ocean-atmosphere coupling in the autumn. Very strong events peak above +2.0 °C.
When do super El Niños peak?
The giants of 1982-83, 1997-98 and 2015-16 all peaked in or next to November-January.
How strong is the 2026-27 El Niño compared with the giants?
As of NOAA's figures, it reached a preliminary +2.5 °C on the traditional ONI and +2.0 °C on the relative RONI for August-October 2026 and was still rising, with an 83% chance of a historic event in October-December.
What happens after a super El Niño?
It usually collapses within a year and often swings into La Niña, as after 1982-83 and 1997-98.