At a glance
No instrument network watched the Pacific in 1877. There were no buoys, no satellites and no forecasts. What survives are ship logbooks, rain gauges in colonial cities and the records of a famine that reached from the Deccan plateau to the hills of northern China and the dry interior of Brazil. Put together, they point to one of the most powerful El Niños of the last two centuries.
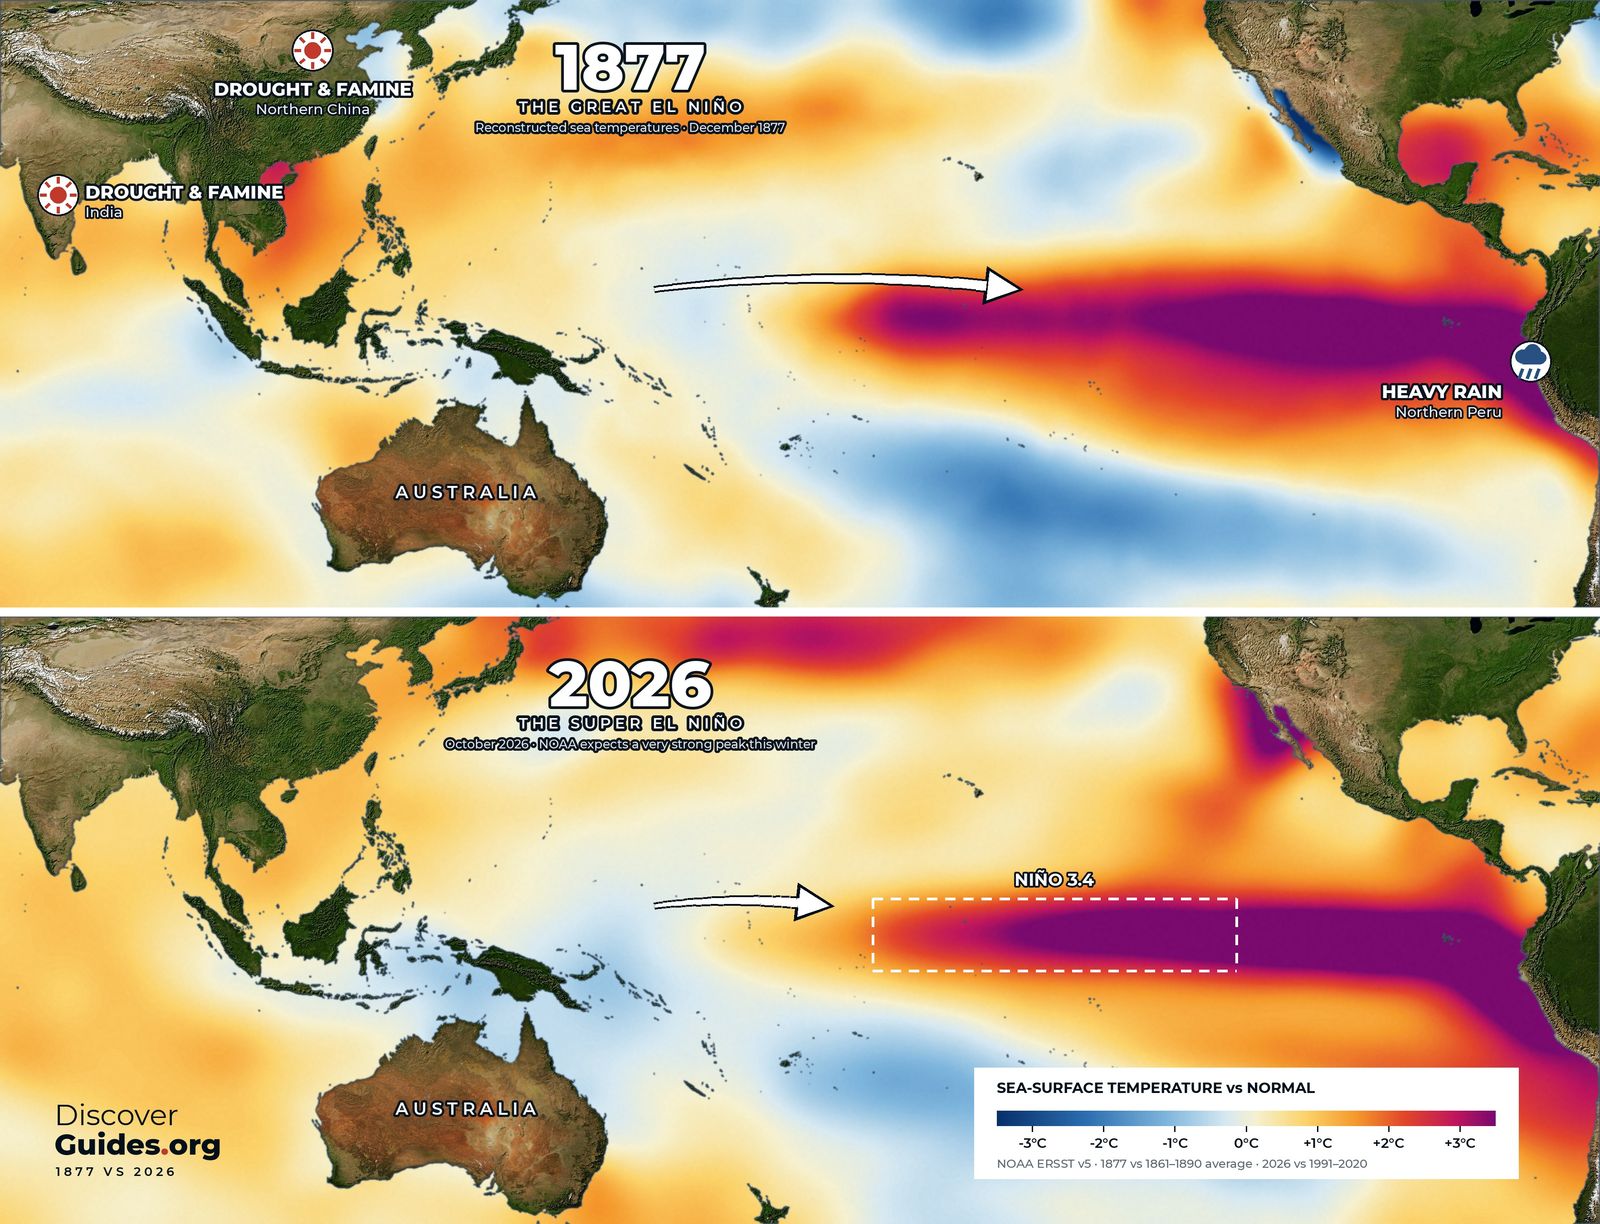
It reads as a warning as well as a history. The comparison in the graphic above is deliberate: the tongue of warm water across the eastern Pacific in December 1877 looks strikingly like the one NOAA was tracking in October 2026.
What the ocean was doing
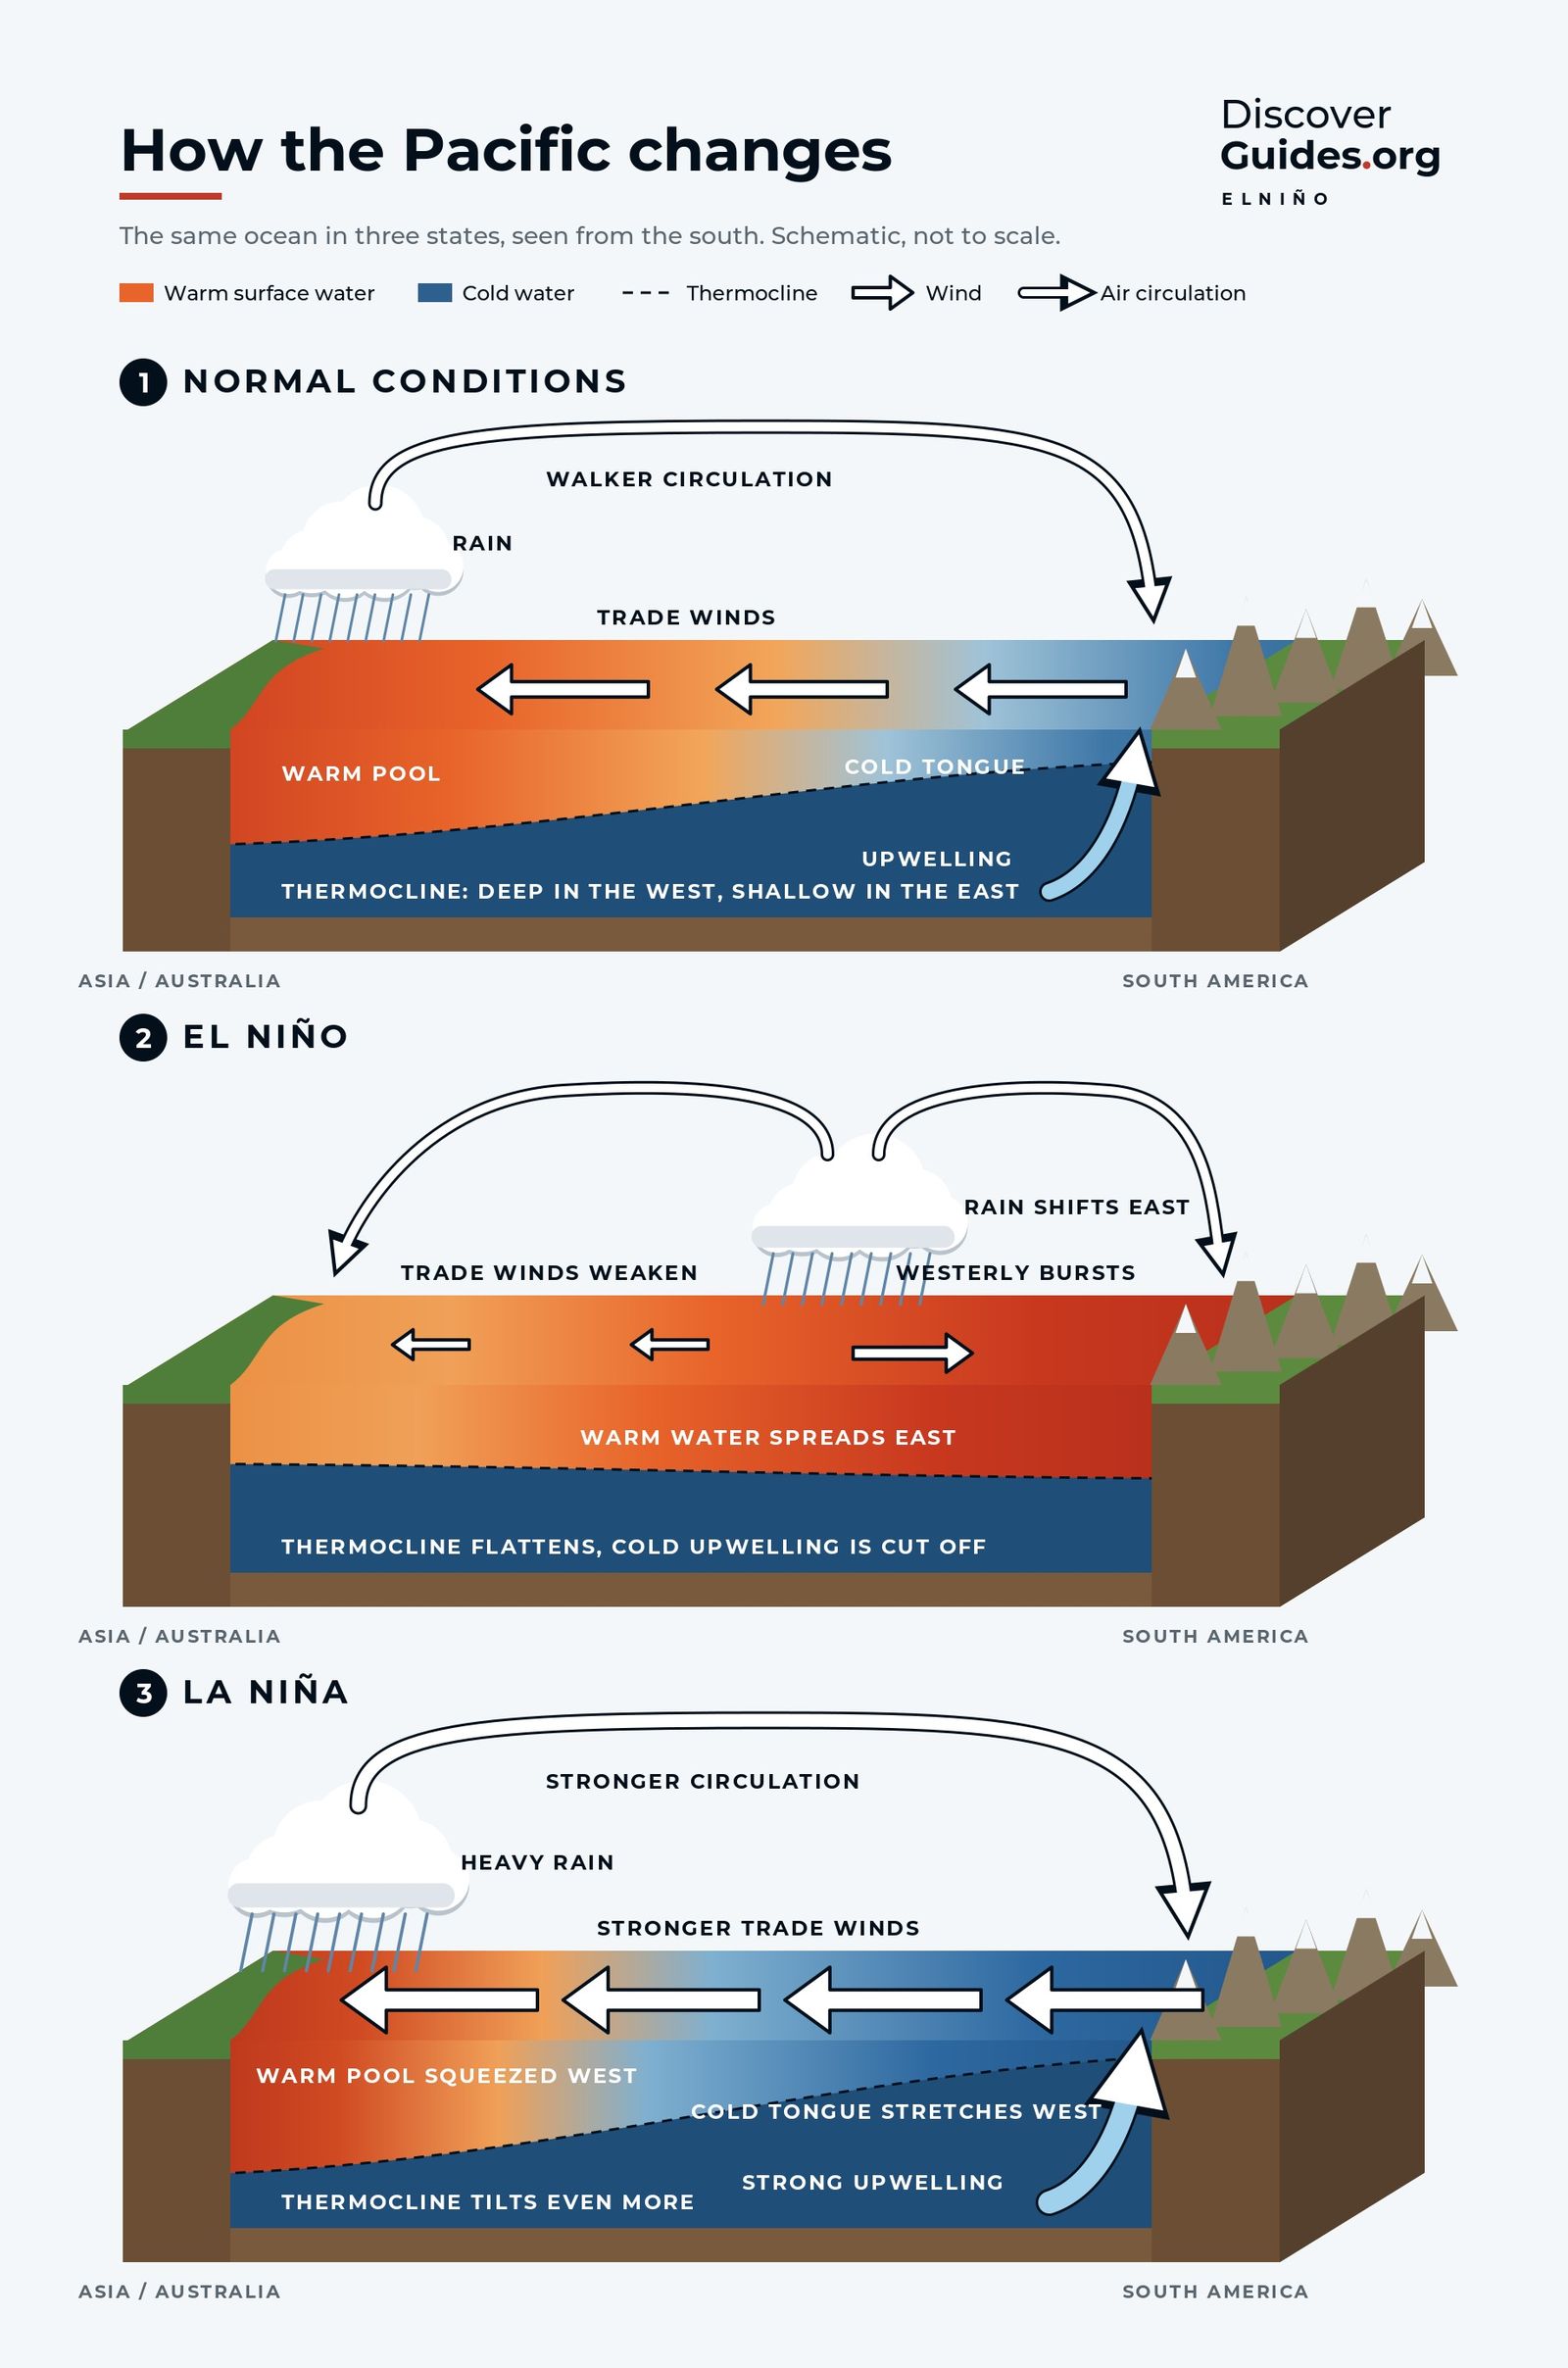
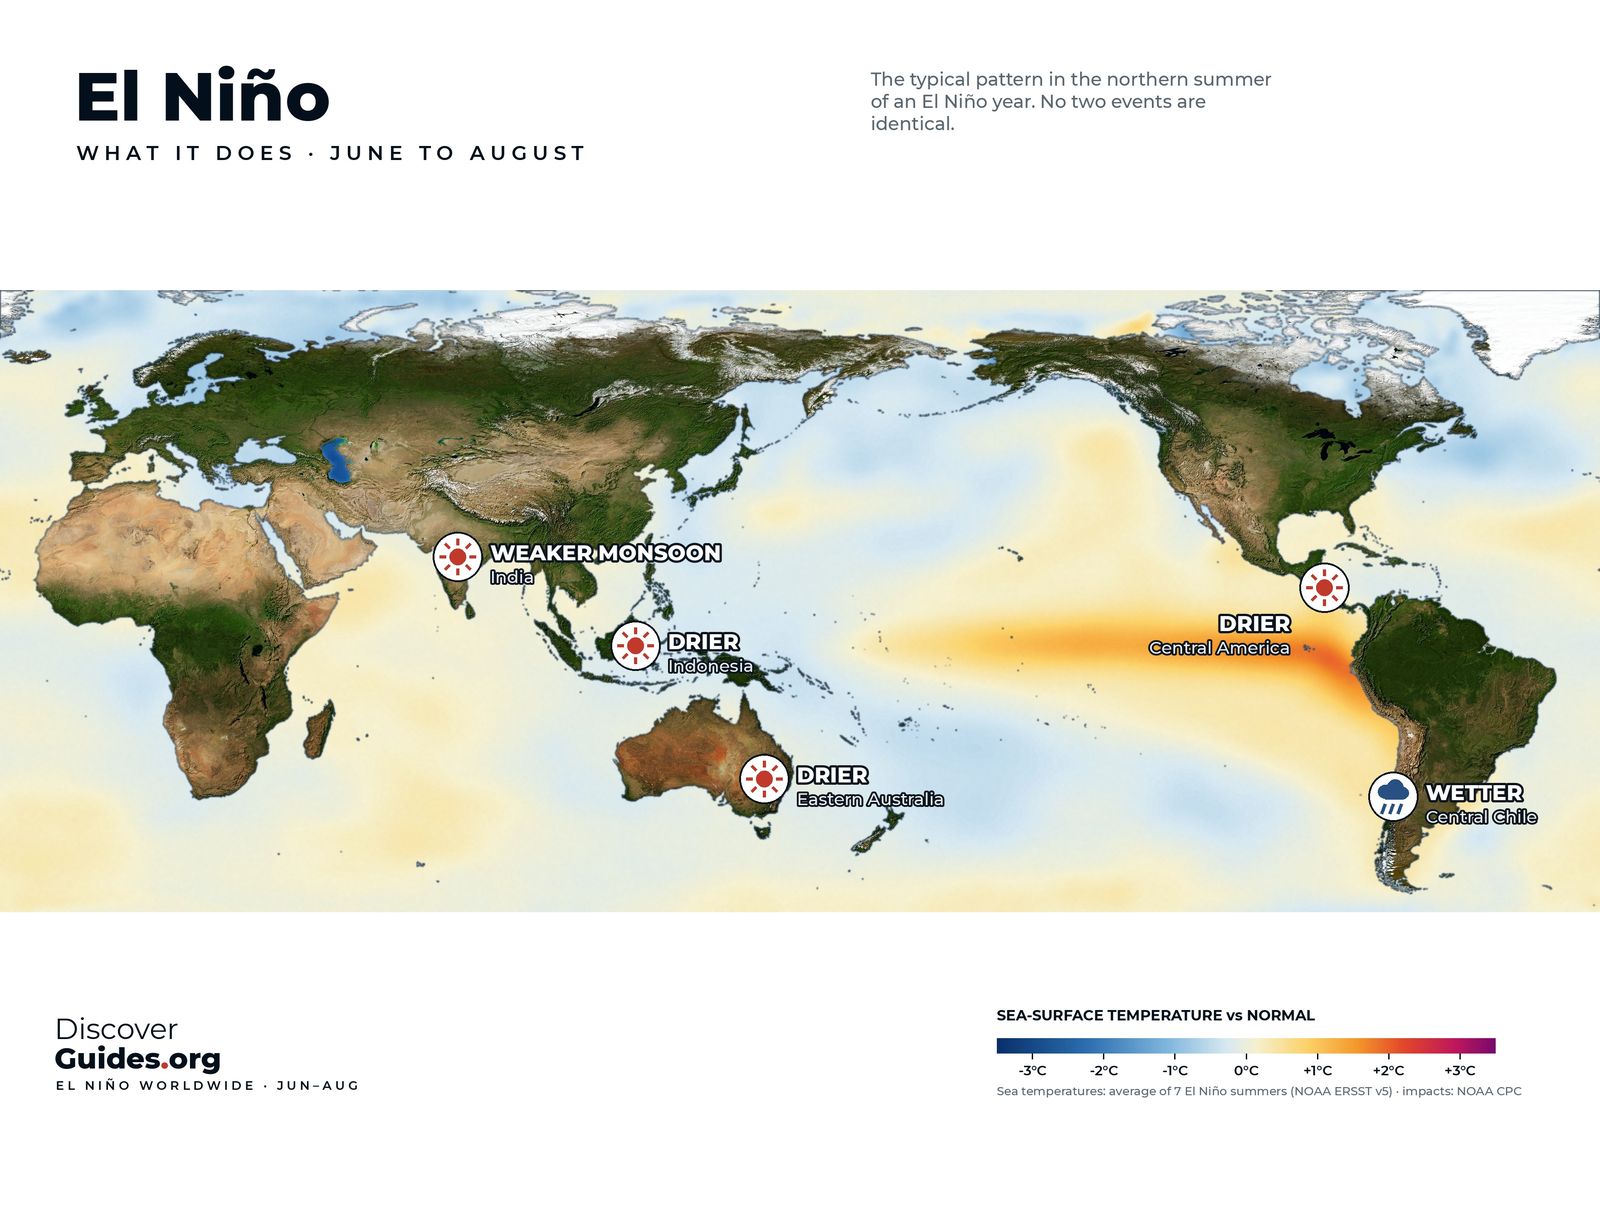
In an El Niño the trade winds that normally pile warm water into the western Pacific weaken, and that warm water spreads east along the equator (the basics are in what El Niño is). Reconstructions of sea surface temperature built from nineteenth-century ship observations show exactly this by late 1877: a long band of unusually warm water from the central Pacific to South America, and heavy rain on the normally dry coast of northern Peru.
A 2018 study in the Journal of Climate, led by Deepti Singh with colleagues at Columbia University's Lamont-Doherty Earth Observatory, found that the El Niño did not act alone. It coincided with the strongest Indian Ocean Dipole known and with the warmest North Atlantic temperatures on record at the time. Three ocean extremes lined up at once, and together they spread drought across several continents in the same few years.
How we know
Nobody measured Niño-3.4 in 1877. The picture comes from three kinds of evidence. Sailing ships logged the temperature of the sea along their routes, and millions of those readings have since been digitised and stitched into long datasets such as NOAA's ERSST, which underlies the 1877 map above. Weather stations in India, Australia and the Americas kept rain and pressure records. And natural archives, such as the growth bands in long-lived corals and tree rings, preserve a record of wet and dry years.
Each source has gaps. Large parts of the Pacific had almost no ships in the 1870s, so the 1877 map is a statistical best estimate rather than a photograph, and the values on it carry far more uncertainty than those for 2026. What the evidence agrees on is the pattern: a warm eastern Pacific, a failed Asian monsoon and drought across the tropics at the same time.
Three continents, one famine
- India. The monsoon failed in 1876 and again in 1877, one of the driest years in India's long rainfall record. The Great Famine of 1876-78 struck hardest in the south and west, in the Madras and Bombay presidencies.
- Northern China. Drought from 1876 to 1879 across the northern provinces, including Shanxi and Henan, caused one of the deadliest famines in Chinese history.
- Brazil. The Grande Seca, the great drought of 1877-79, emptied the sertão of the north-east, with the state of Ceará hit hardest.
- Elsewhere. Drought also reached southern Africa, parts of north and west Africa, and Australia.
Death tolls from the 1870s are estimates, not counts. Figures for the combined famines usually run from about 30 to 60 million. The Lamont-Doherty team put the total near 50 million, which places it alongside the deadliest wars and pandemics of the twentieth century.
Why drought became catastrophe
Weather explains the failed harvests. It does not fully explain the deaths. Historians have documented that grain kept leaving India by rail and ship for export during the famine, and that official relief was kept deliberately meagre. In Late Victorian Holocausts (2001), the historian Mike Davis argued that colonial policy and global markets turned a climate shock into mass death across the tropics.
His framing is debated, but the core point is widely accepted: the same drought kills far more people where food reserves, relief and political will are missing. That lesson applies to every strong El Niño since.
The disaster that rewrote history
The famine changed science as well as politics. British India expanded its young meteorological service, and in the 1880s it began issuing some of the world's first seasonal monsoon forecasts. The search for warning signs that could predict the next failed monsoon eventually led Gilbert Walker, who took charge of India's observatories in 1904, to a giant pressure see-saw between the Indian and Pacific Oceans. He named it the Southern Oscillation, and it turned out to be the atmospheric half of El Niño (see the Southern Oscillation explained).
It took until the late 1960s, when the Norwegian-American meteorologist Jacob Bjerknes linked Walker's see-saw to the warm water off Peru, for the two halves to be joined into a single ocean-atmosphere system. The famine of the 1870s sits at the root of that chain of discovery.
1877 and 2026: how close?
Comparing an event rebuilt from sparse ship logs with one measured by satellites and buoys has limits, and the error bars on 1877 are wide. Still, reconstructions place 1877-78 in the same top tier as 1982-83, 1997-98 and 2015-16 (see the strongest El Niños, ranked).
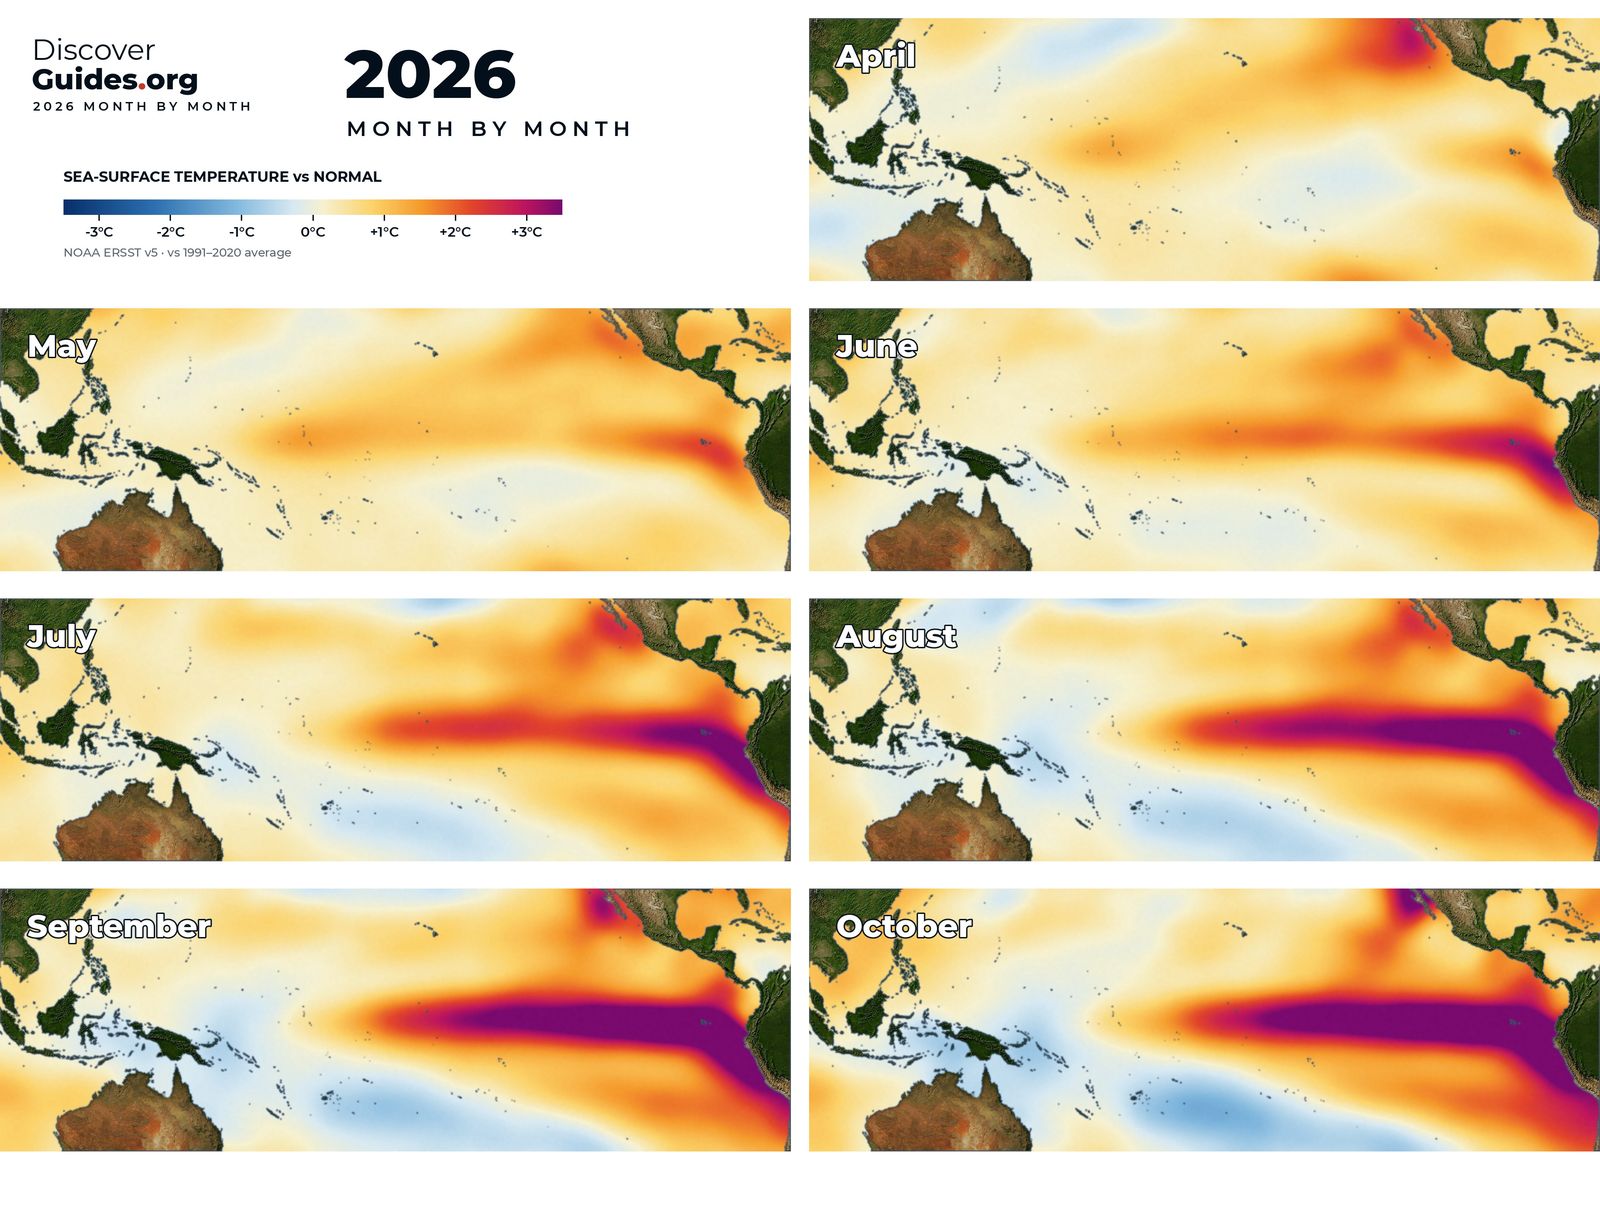
As of NOAA's October 2026 update, the current event had pushed sea surface temperatures more than 4°C (7.2°F) above normal in parts of the eastern equatorial Pacific, and forecasters gave an 83% chance that October to December would pass the historic mark of +2.5°C on NOAA's relative index, beyond any event since 1950. Outlooks can change, and the next update is due on 12 November 2026. The latest is tracked in the 2026-27 super El Niño.
The difference that matters most is not in the ocean. Today there are seasonal forecasts months ahead, famine early-warning systems and global food trade. The story of 1877 is told in full, alongside every great event since, in the book Discover El Niño.
Questions
When was the Great El Niño?
The event built through 1877 and peaked around the turn of 1877-78. The droughts and famines linked to it ran from 1876 to 1879, at different times in different regions.
How many people died in the famine of 1876-78?
Nobody knows precisely. Estimates for the famines in India, China, Brazil and elsewhere usually range from about 30 to 60 million; a 2018 Lamont-Doherty study put the total near 50 million.
Was 1877-78 the strongest El Niño ever?
It is among the strongest ever reconstructed, in the same class as 1982-83, 1997-98 and 2015-16. Nineteenth-century ocean data are too sparse to rank it precisely.
Could a famine like 1877 happen again?
The scientists behind the 2018 study warned that a similar combination of ocean extremes could recur. Forecasts, aid and trade make famine on that scale far less likely today, but strong El Niños still threaten food security in vulnerable regions.