At a glance
Before 1982, many scientists thought El Niño followed a script. Warm water would appear first off South America early in the year, then spread west along the equator. The 1982-83 event ignored that script, and the tools meant to catch it were blinded at the worst possible moment.
How a volcano hid an El Niño
In March and April 1982, El Chichón erupted in southern Mexico and threw a cloud of sulphate aerosols into the stratosphere. Satellite instruments that estimated sea surface temperature from infrared light were not built to correct for it. A later review by NOAA's Pacific Marine Environmental Laboratory found that the aerosols made satellite readings too cold by several degrees, so ocean analyses showed a near-normal or even cool equatorial Pacific for much of 1982.
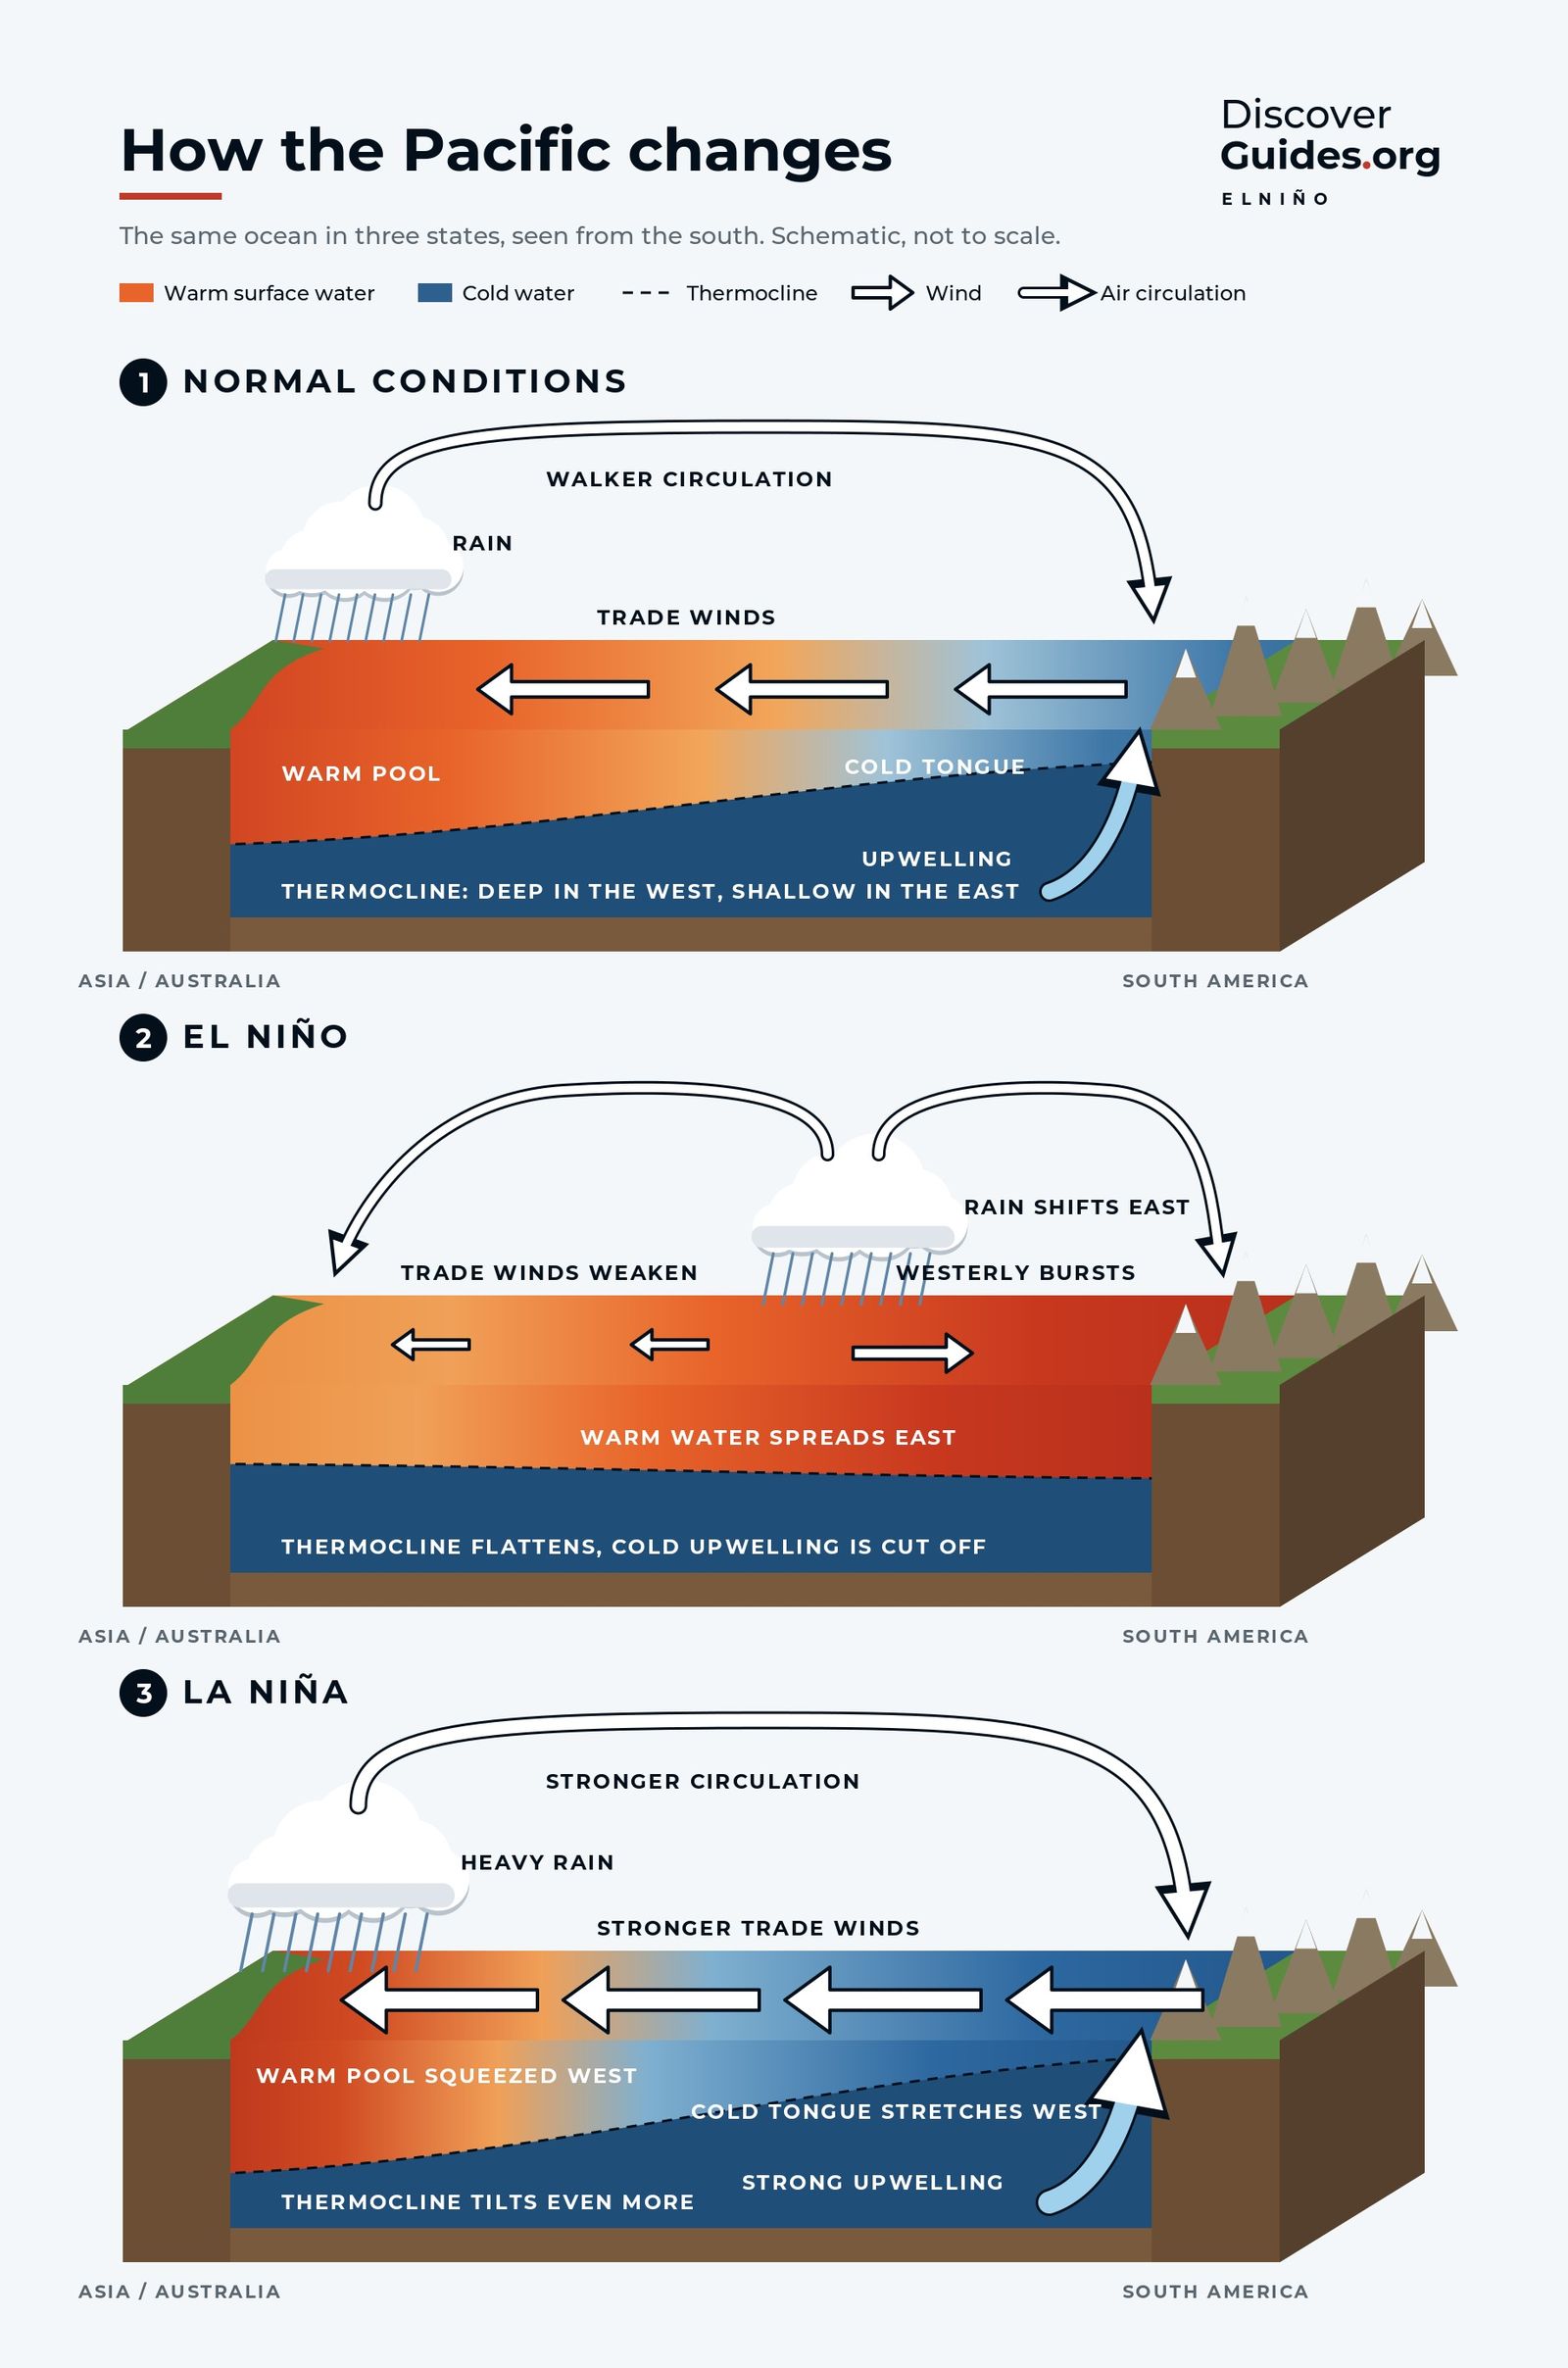
Ship and island reports that did show warming were rejected as errors because they disagreed with the satellites. The usual warning signs were missing as well: there was no early warming off South America. In the words of that NOAA review, the event was "neither predicted nor even detected until several months after it had started". The penny dropped in late 1982, when the research vessel Conrad found the thermocline, the boundary between warm surface water and cold deep water, far deeper than normal in the eastern Pacific.
What it did to the world
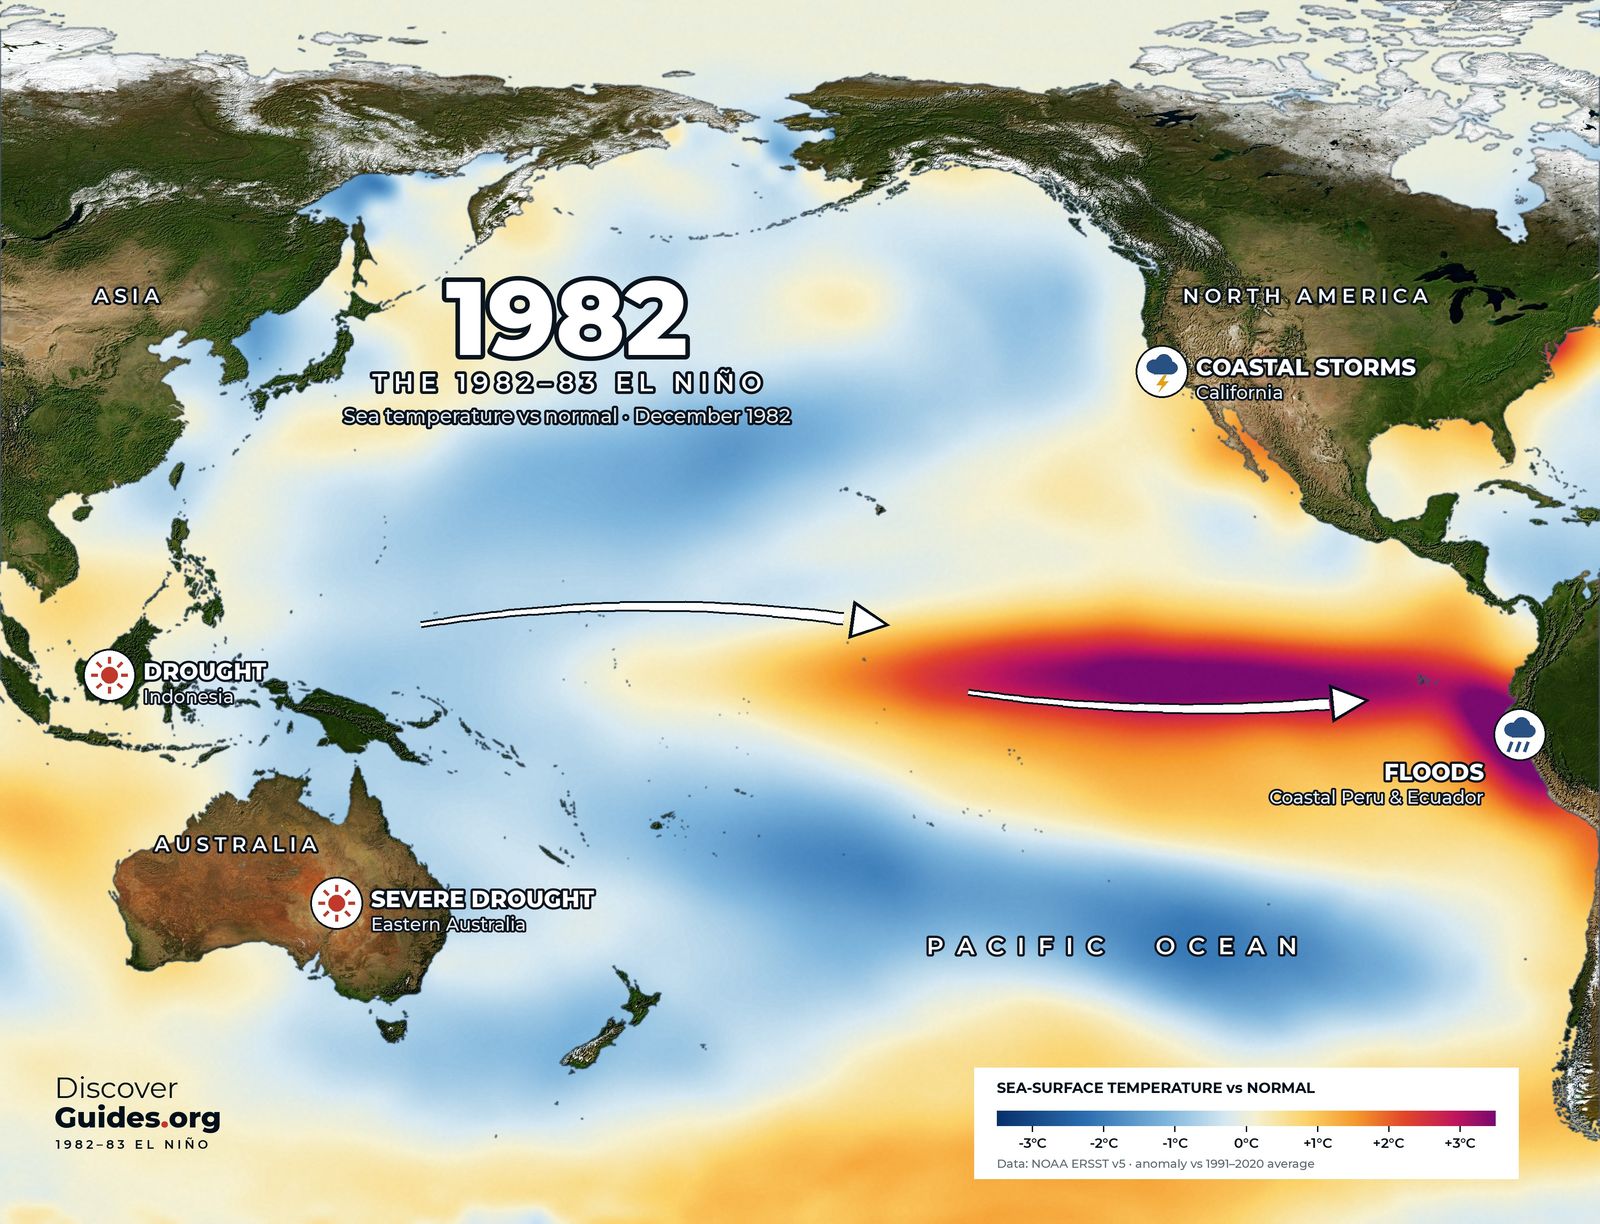
The event peaked around December 1982 and January 1983, with the warmest water packed against the coasts of Ecuador and Peru, as the map above shows. Its effects reached every inhabited continent.
- Peru and Ecuador. Months of torrential rain on a normally desert coast, with rivers bursting their banks and roads and bridges washed away (more in El Niño in Peru).
- Australia. One of the worst droughts of the century across eastern Australia, ending in the Ash Wednesday bushfires of February 1983 in Victoria and South Australia.
- Indonesia and southern Africa. Severe drought and failed harvests.
- California. A run of powerful winter storms battered the coast. NOAA puts storm damage in California at about $2.2 billion.
- The Galápagos. The sea ran so warm that most of the islands' reef-building coral died, and seabirds, sea lions and marine iguanas starved as the food web collapsed.
Global estimates of the human and economic toll vary widely between sources, but all run to billions of dollars in losses.
A warm ocean, an empty sea
Out in the Pacific, the event emptied whole ecosystems. On Kiritimati (Christmas Island) in the central Pacific, scientists in late 1982 found that the vast seabird colonies had abandoned their nests and chicks as the fish they depended on disappeared. Off Peru the anchoveta scattered and catches collapsed, and the seabirds and sea lions that feed on them starved.
In the South Pacific the warm water shifted the cyclone belt east. Several tropical cyclones struck French Polynesia in the 1982-83 season, an area where they are normally rare. The same warmth bleached and killed corals across the eastern Pacific, a preview of the global bleaching events that would follow in later El Niños.
How strong was it?
On NOAA's relative Oceanic Niño Index (RONI), which compares the central Pacific with the tropics as a whole and became NOAA's main ENSO measure in 2026, 1982-83 peaked at about +2.4°C (4.3°F) over November to January and December to February. In NOAA's current tables that is the highest peak of any El Niño since 1950.
On the older Oceanic Niño Index the same event peaks lower, at about +2.1°C, because the two indices treat the background warming of the tropics differently. Either way, 1982-83 sits firmly among the strongest El Niños in history.
The event that built the warning system
The miss shook the field. It fed directly into the Tropical Ocean Global Atmosphere programme (TOGA), a ten-year international effort that ran from 1985 to 1994, and into the Tropical Atmosphere Ocean (TAO) array: a line of moored buoys across the equatorial Pacific that reports winds and the temperature of the upper ocean in real time. NOAA describes the array as installed after 1982-83 to give scientists the view of the tropical Pacific they had lacked.
The payoff came quickly. The next giant, the 1997-98 El Niño, was spotted in its first months and forecast well ahead. The descendants of those buoys and models still produce every El Niño forecast today, as explained in how El Niño forecasts are made.
Lessons for 2026-27
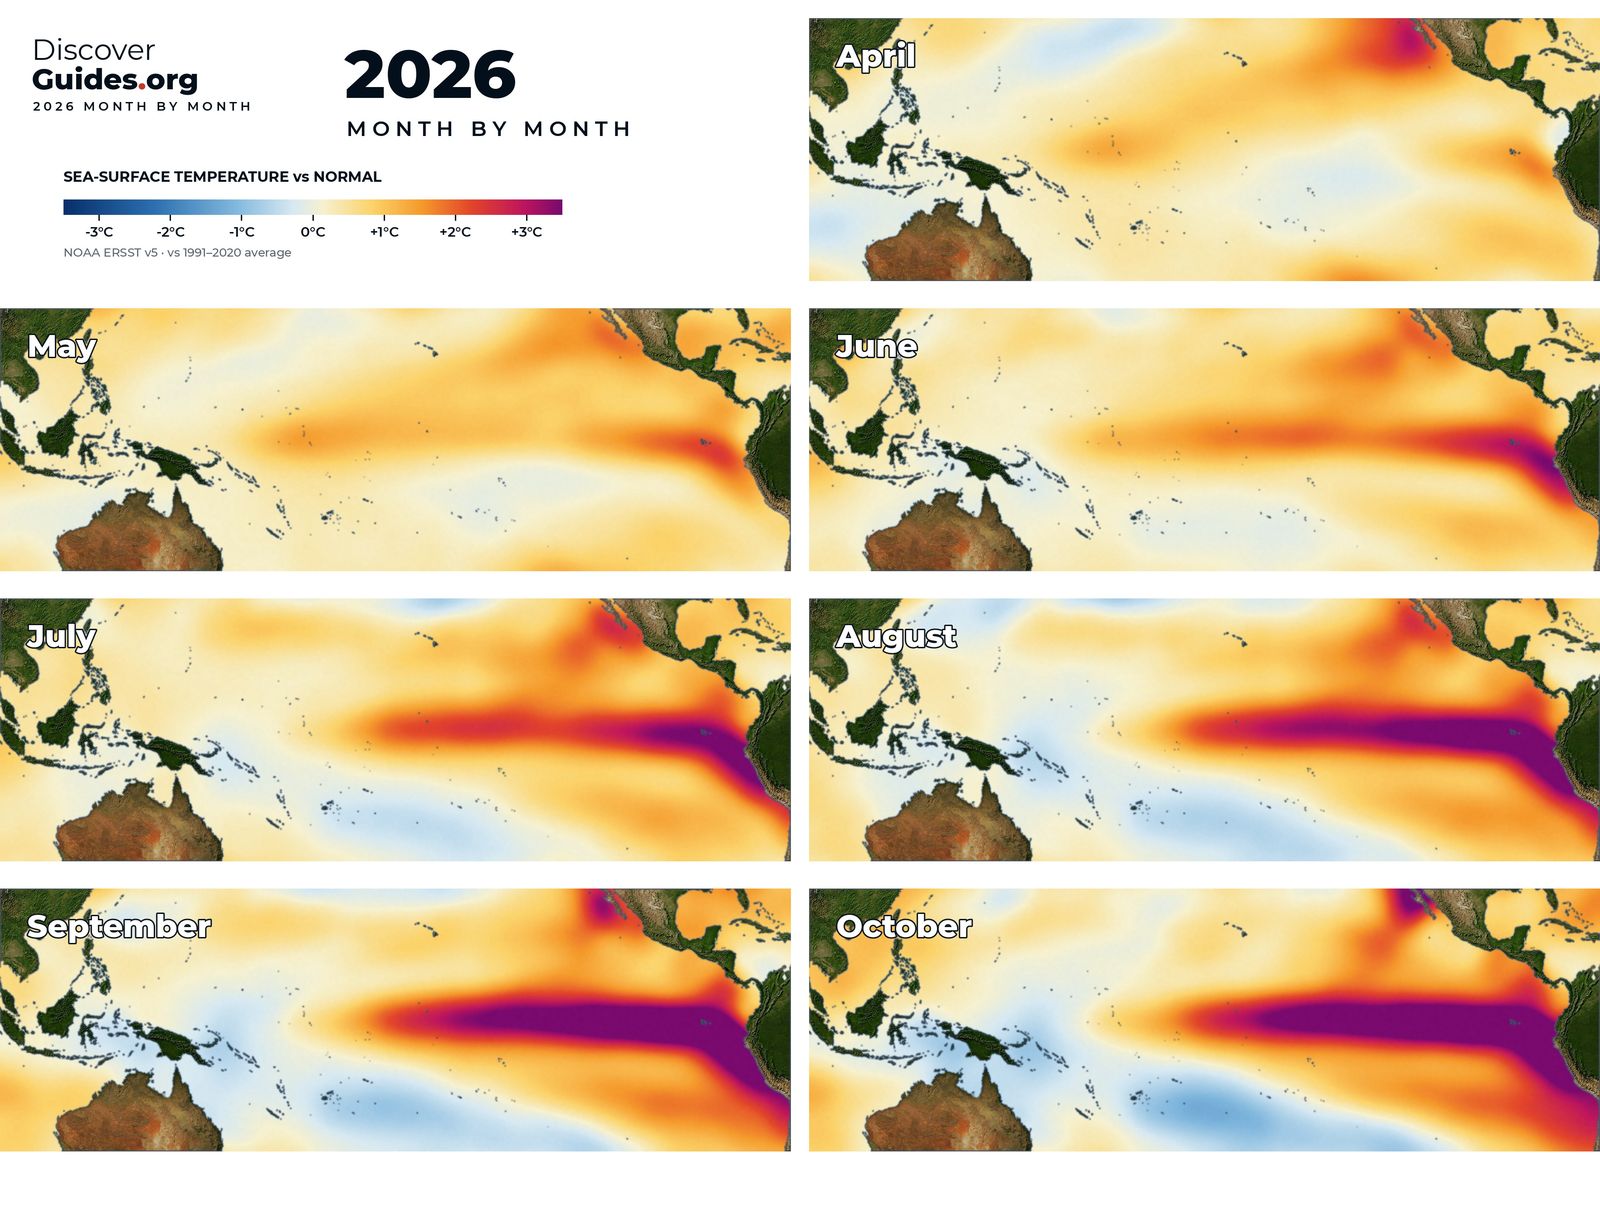
1982-83 is the reminder that no two El Niños are alike. It started late, grew fast and was strongest far to the east, close to South America. The 2026-27 event, by contrast, has been watched from the start. As of NOAA's October 2026 update, an El Niño Advisory was in force, the event had strengthened further in September, and a strong to very strong El Niño was considered likely through January to March 2027. Outlooks can change from month to month.
The full story of the 1982-83 giant, and how it compares with the event now under way, is in the book Discover El Niño.
Questions
Why was the 1982-83 El Niño not predicted?
Aerosols from the 1982 eruption of El Chichón made satellite sea temperature readings too cold, accurate ship reports were rejected as errors, and the event did not follow the expected pattern. NOAA scientists later wrote that it was not even detected until several months after it began.
How strong was the 1982-83 El Niño?
It peaked at about +2.4°C on NOAA's relative Niño-3.4 index, the highest of any event since 1950 in NOAA's current tables, and about +2.1°C on the traditional Oceanic Niño Index.
What did the 1982-83 El Niño cause?
Floods in coastal Peru and Ecuador, severe drought in eastern Australia, Indonesia and southern Africa, damaging winter storms in California and mass die-offs of coral and wildlife in the Galápagos.
What changed after the 1982-83 El Niño?
It led to the international TOGA research programme (1985-1994) and to the TAO buoy array across the equatorial Pacific, which made the next great El Niño, 1997-98, the first to be forecast months ahead.