At a glance
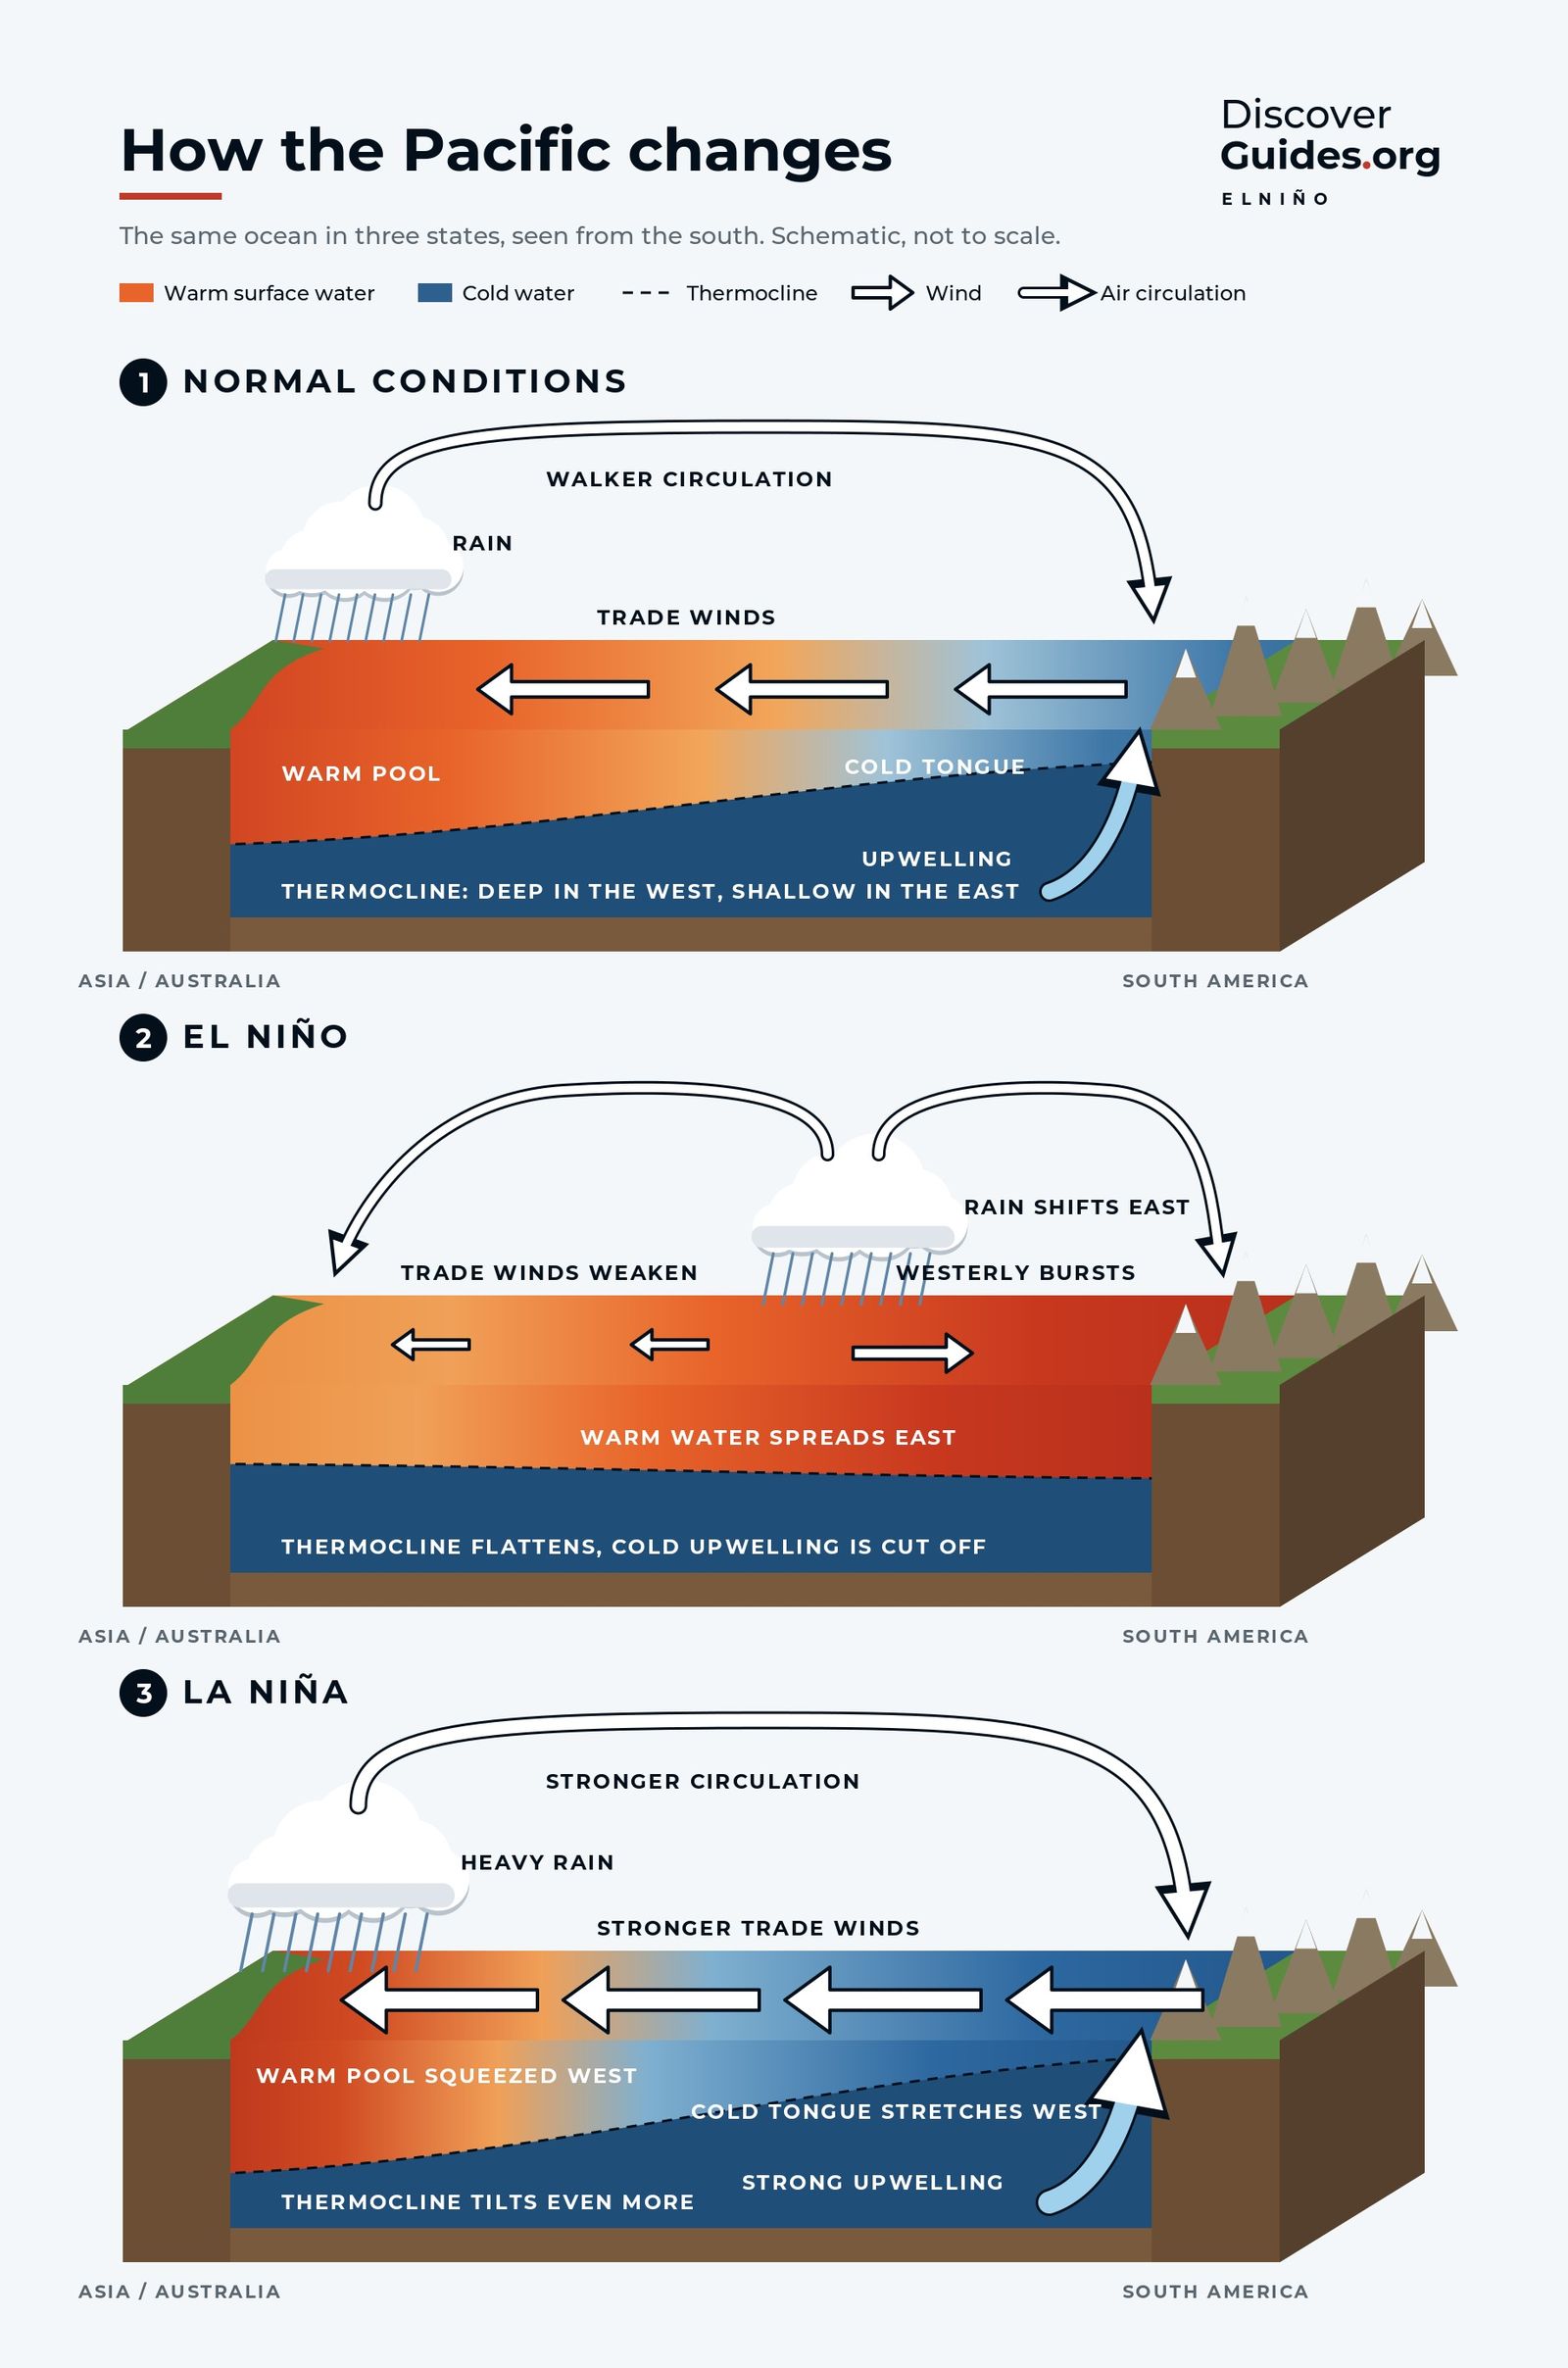
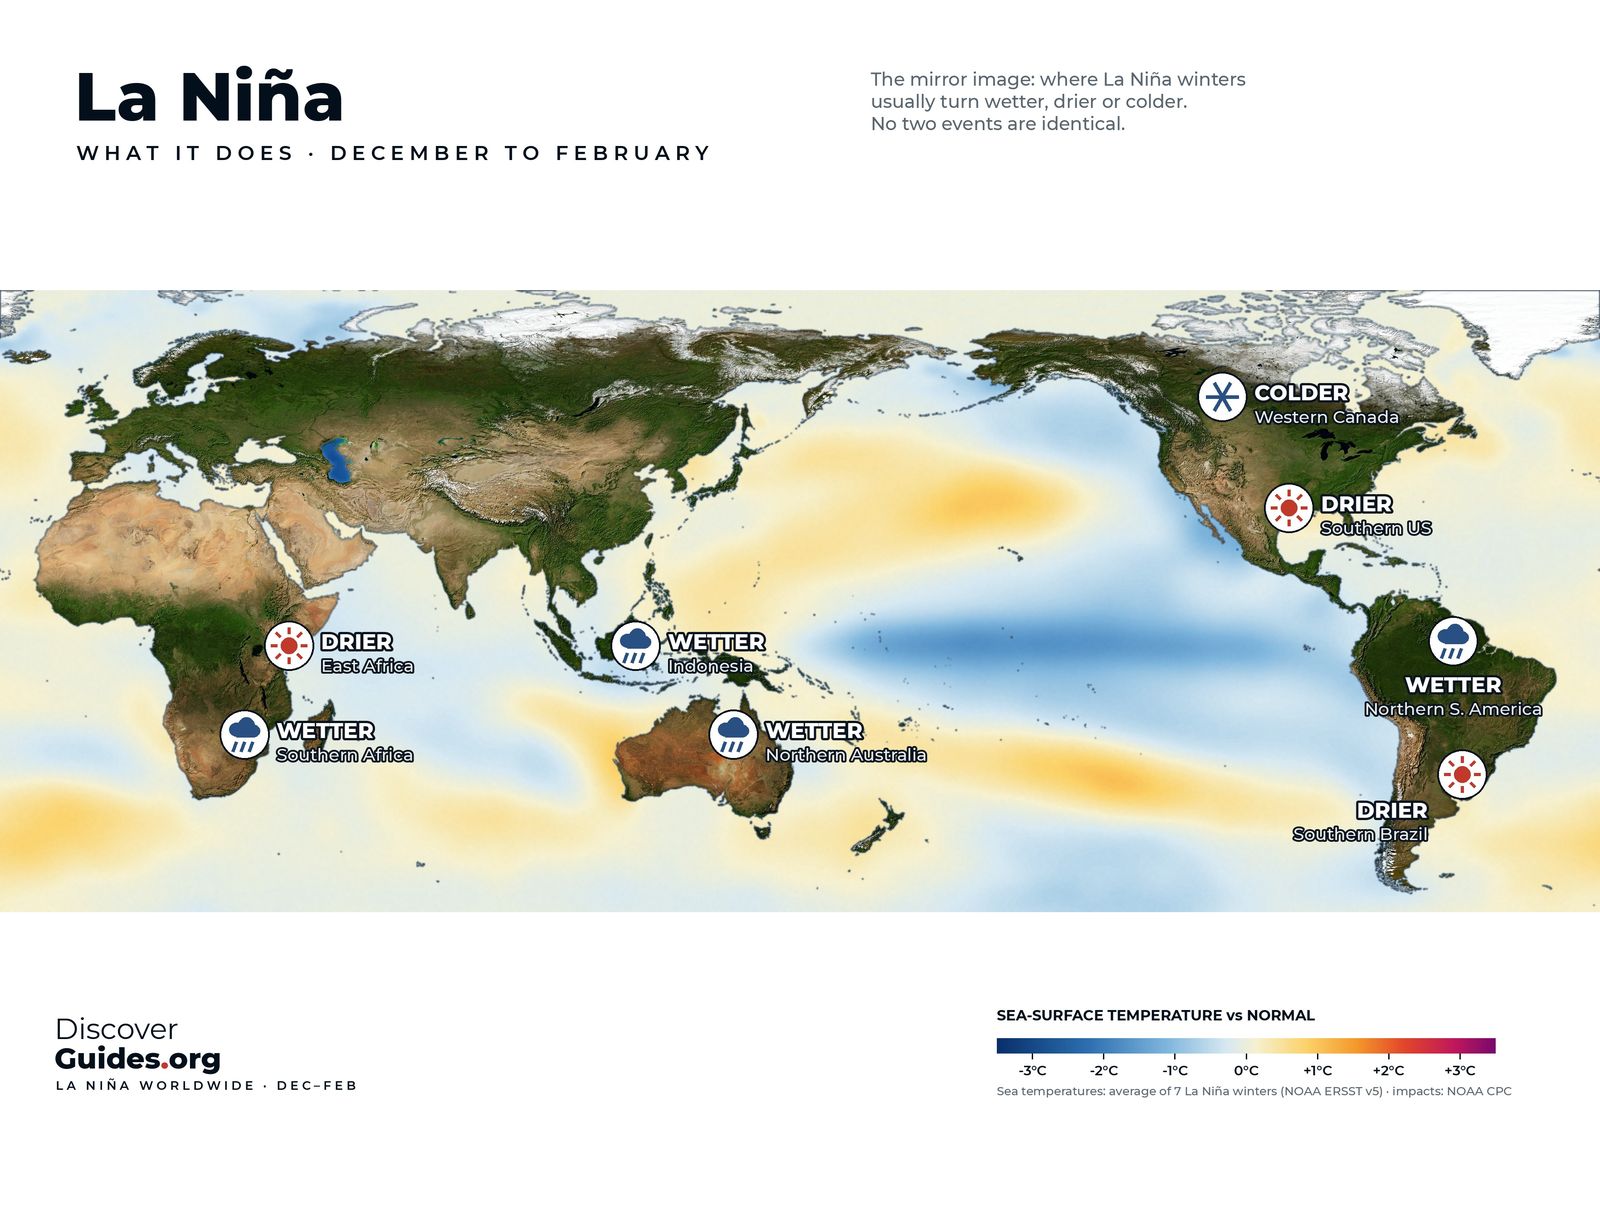
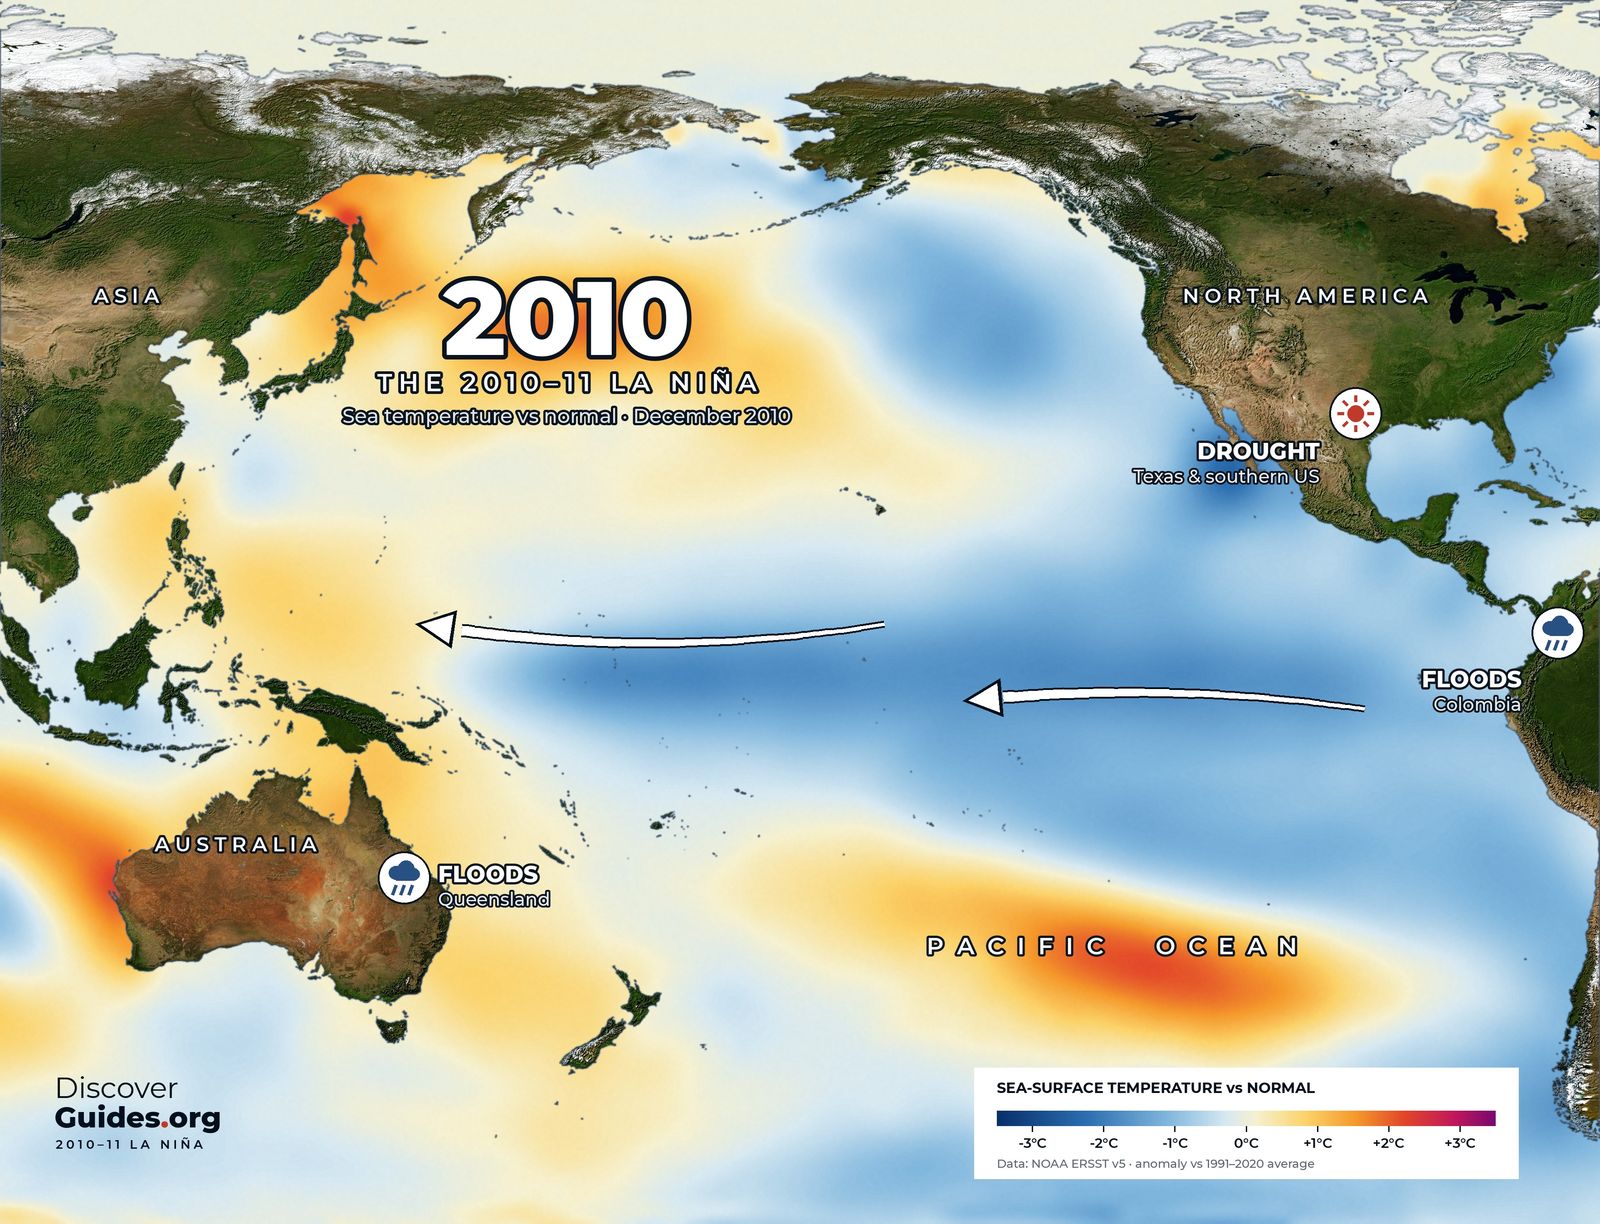
La Niña strengthens the Walker circulation: rising air and rain increase over the Maritime Continent of Indonesia and over northern South America, while sinking air over the eastern Pacific strengthens, drying an already dry region (see The Strongest La Niñas on Record). The World Meteorological Organization summarises the classic picture shown on the map at the top of this page.
La Niña's usual suspects (northern winter)
| Region | Typical La Niña tendency |
|---|---|
| Australia and Indonesia | Wetter than normal; El Niño's drought risk reverses |
| South-East Asia | Stronger, longer monsoon rains |
| Northern South America | Wetter |
| Southern Africa | Wetter |
| Horn of Africa | Drier: failed short rains are a hallmark |
| Southern South America | Drier in Patagonia and parts of Argentina |
| Southern United States | Warmer and drier than average |
| Pacific Northwest and Ohio Valley | Wetter; north-central Plains colder |
North America
NOAA's Climate.gov describes a typical La Niña winter in the United States as warmer and drier than average across the southern tier, wetter in the Ohio Valley and the Pacific Northwest, and colder than average in the north-central Plains. The jet stream is the reason: during La Niña it tends to run from the central Rockies east-north-eastward towards the eastern Great Lakes, so storms and severe weather break out further north and west than in El Niño winters (see What Is the Jet Stream?).
The patterns are tendencies, not promises. Looking at the eleven moderate and strong La Niña winters since 1950, Climate.gov found the Pacific Northwest wetter in nine, but the Ohio Valley wetter in only six.
Australia and Asia
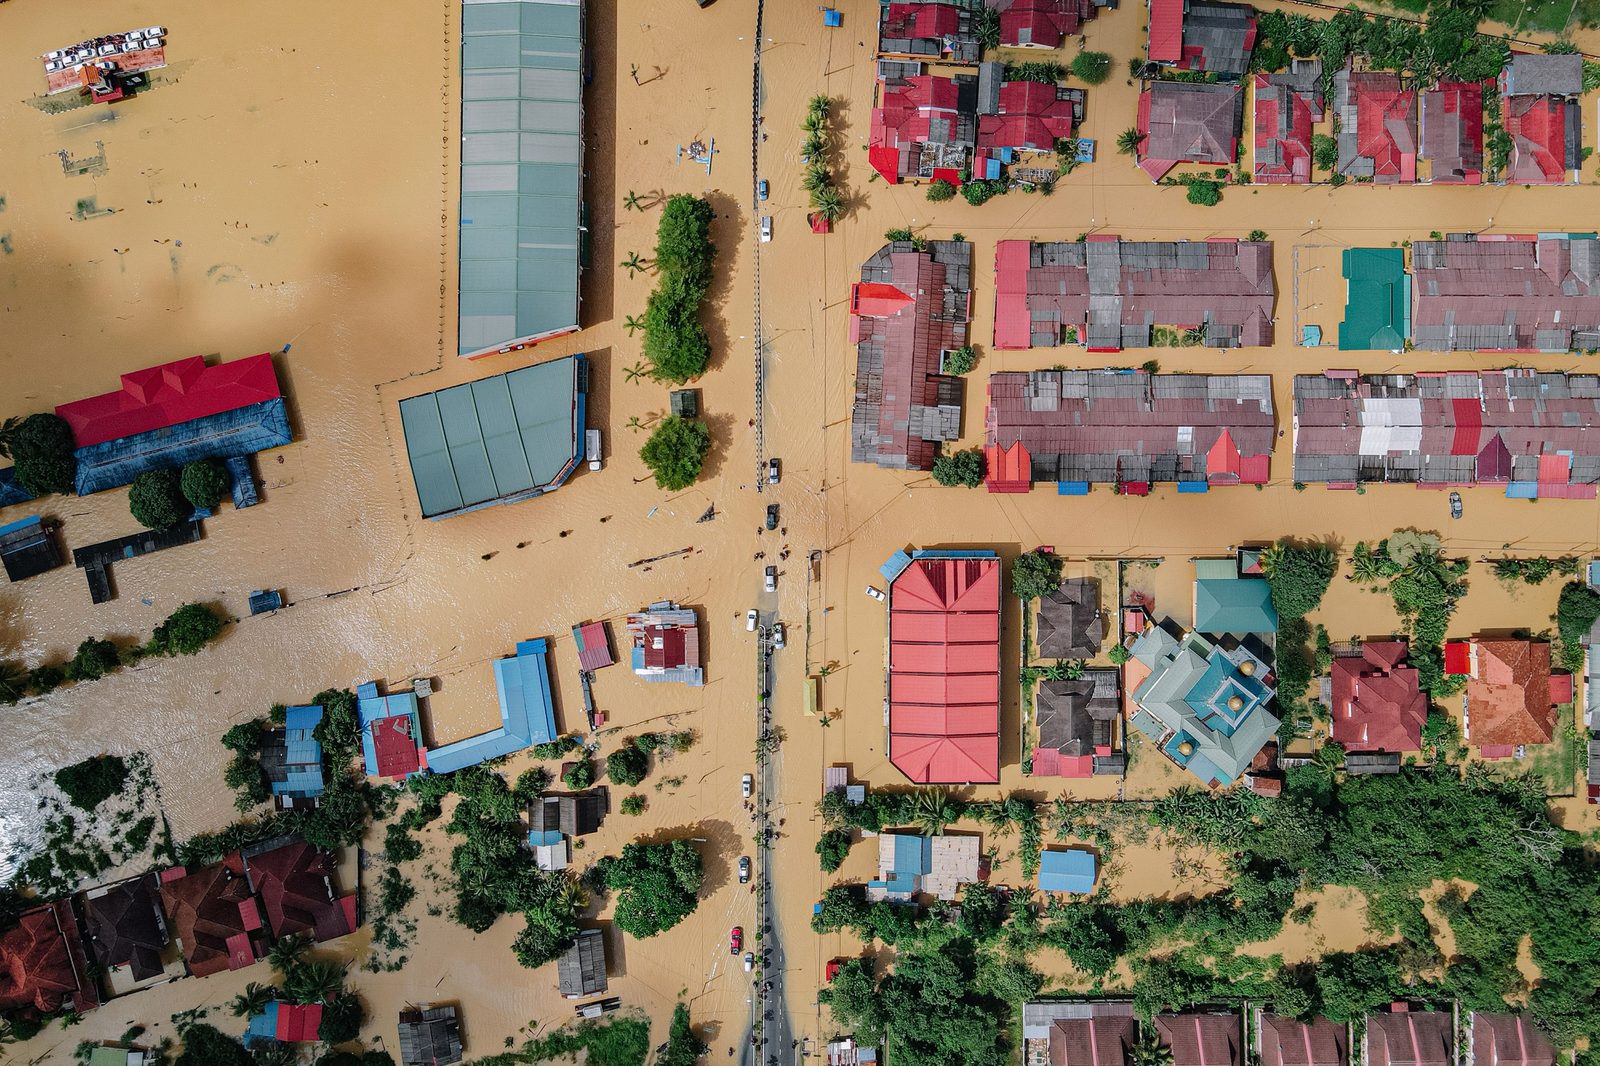
La Niña's most famous footprint is in Australia. The record La Niña of 2010-11 made April 2010 to March 2012 the country's wettest 24-month period on record, flooded the Brisbane River in January 2011, and dumped so much water on the continents that global sea level fell by about 5 mm. In 2022, during the triple dip, Sydney had its wettest year ever (see The Triple-Dip La Niña of 2020-23).
Africa and South America
In the Horn of Africa La Niña is the drought-maker: from late 2020 the short rains failed five seasons running across Ethiopia, Kenya and Somalia. In the south, Argentina received less than half its usual rain in the last four months of 2022, the lowest in 35 years.
A gift to Atlantic hurricanes
La Niña's most dangerous effect may be on hurricanes. NOAA explains that it weakens the upper-level westerly winds over the tropical Atlantic, reducing the vertical wind shear that tears developing storms apart. The result is a more active Atlantic season and a quieter eastern Pacific, the reverse of El Niño. McPhaden estimated that an intense hurricane is about three times more likely to make landfall in the United States during La Niña than during El Niño. Hurricane Mitch, which struck Central America in 1998 during La Niña, killed about 10,000 people (see How Hurricanes Work).
Europe
Europe's link is faint and delayed. A 2024 Met Office study found that winters in which El Niño was followed by La Niña, such as 1988-89, 1998-99 and 2007-08, were mild and stormy in the UK. For El Niño's own map, see What El Niño Means for Weather Around the World.
Local tipA Pacific forecast is not a forecast of your weather. La Niña shifts the odds; your national weather service's seasonal outlook already folds it in and is the better guide for local decisions.
Questions
What does La Niña do to the weather?
It tends to bring wetter conditions to eastern Australia, Indonesia, northern South America and southern Africa, and drier conditions to East Africa, the southern United States and Patagonia. It also favours more Atlantic hurricanes.
Does La Niña mean a cold winter?
In the United States it tends to bring colder conditions to the north-central Plains and the Pacific Northwest, but a warmer, drier winter across the southern tier.
Why does La Niña cause more Atlantic hurricanes?
It weakens the upper-level westerly winds over the tropical Atlantic, reducing the wind shear that tears developing storms apart.
Does La Niña always bring these effects?
No. They are tendencies. Of eleven moderate and strong La Niña winters since 1950, the Pacific Northwest was wetter in nine, the Ohio Valley in only six.