At a glance
How El Niño strength is measured
Forecasters measure El Niño in a box of ocean on the equator in the central and eastern Pacific called Niño-3.4. They take the sea surface temperature there, compare it with normal, and average it over three months. An El Niño needs a value of +0.5°C or more, together with a matching response in the atmosphere.
For decades NOAA's yardstick was the Oceanic Niño Index (ONI), which compares Niño-3.4 with a 30-year average. In 2026 NOAA's Climate Prediction Center switched to the relative Oceanic Niño Index (RONI), which compares Niño-3.4 with the tropics as a whole. As the tropics warm, the old index increasingly mixed El Niño with background warming; the relative index separates the two.
Labels such as weak, moderate, strong and very strong are informal, as is super El Niño, which is usually applied to events at or above about +2.0°C.
The modern giants, ranked
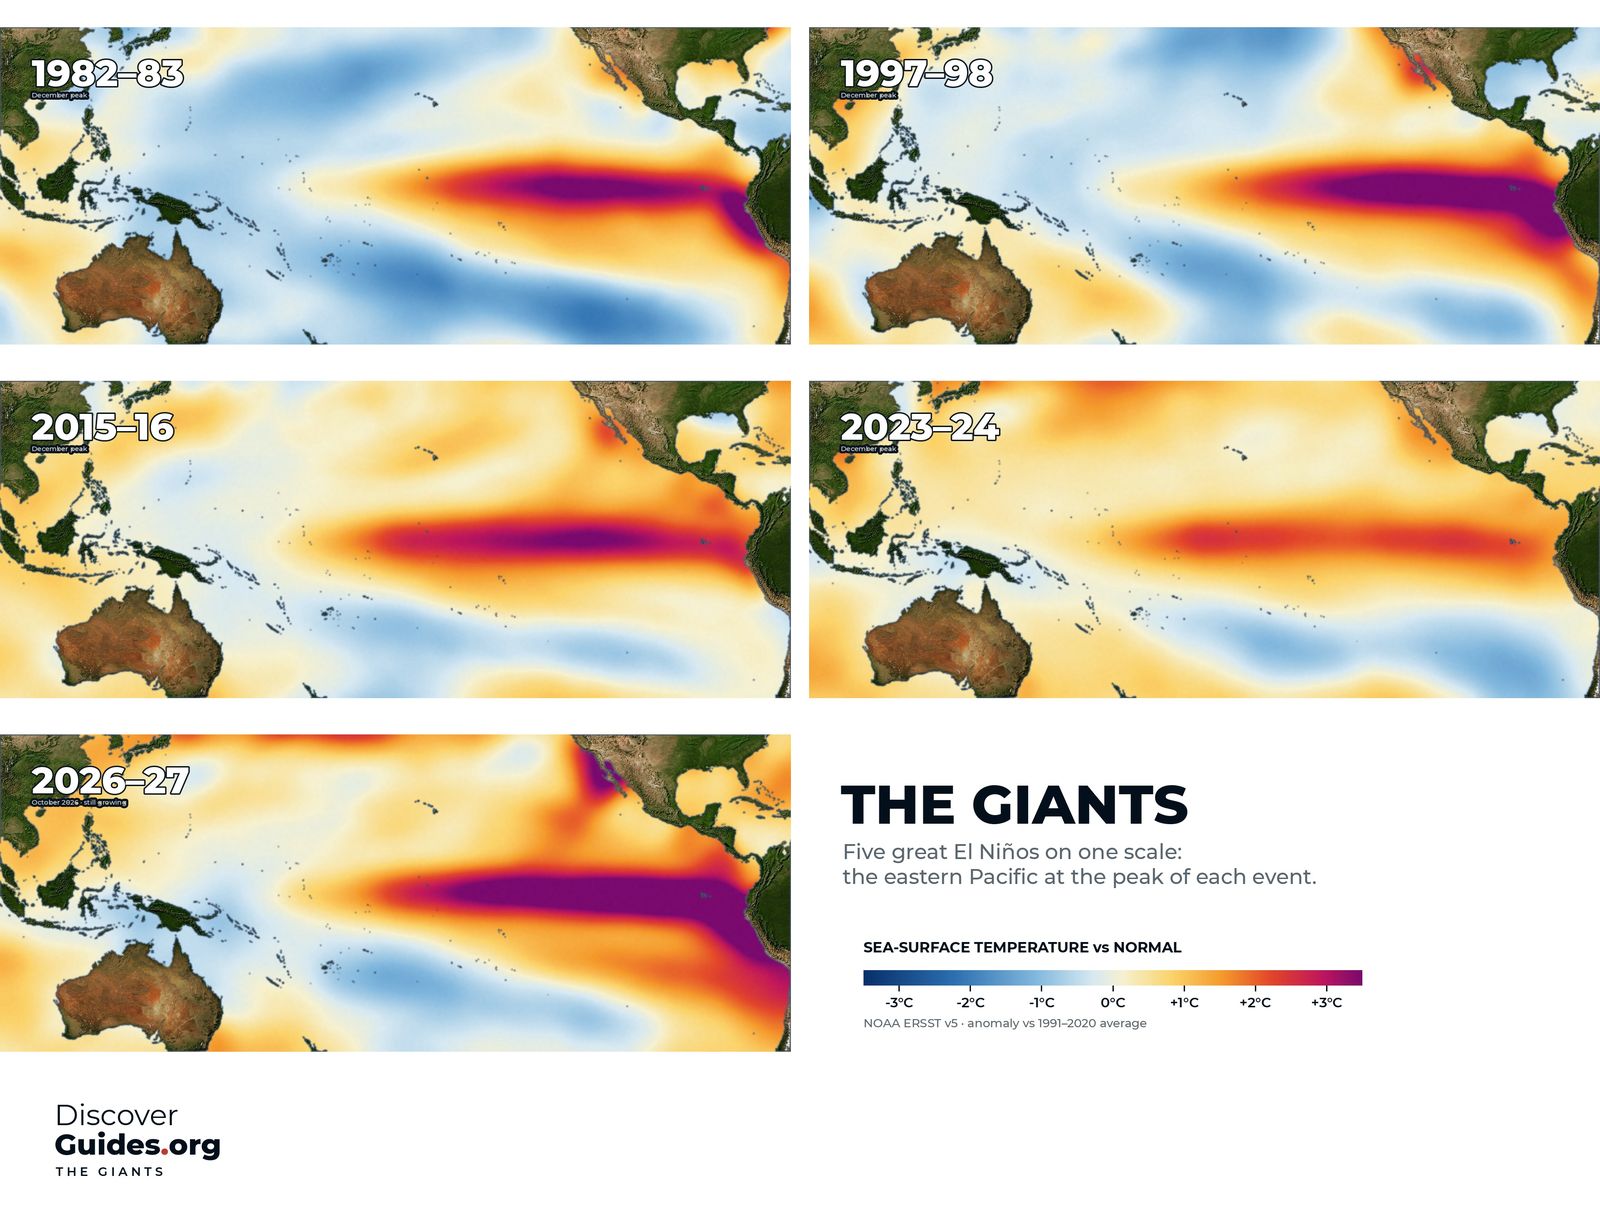
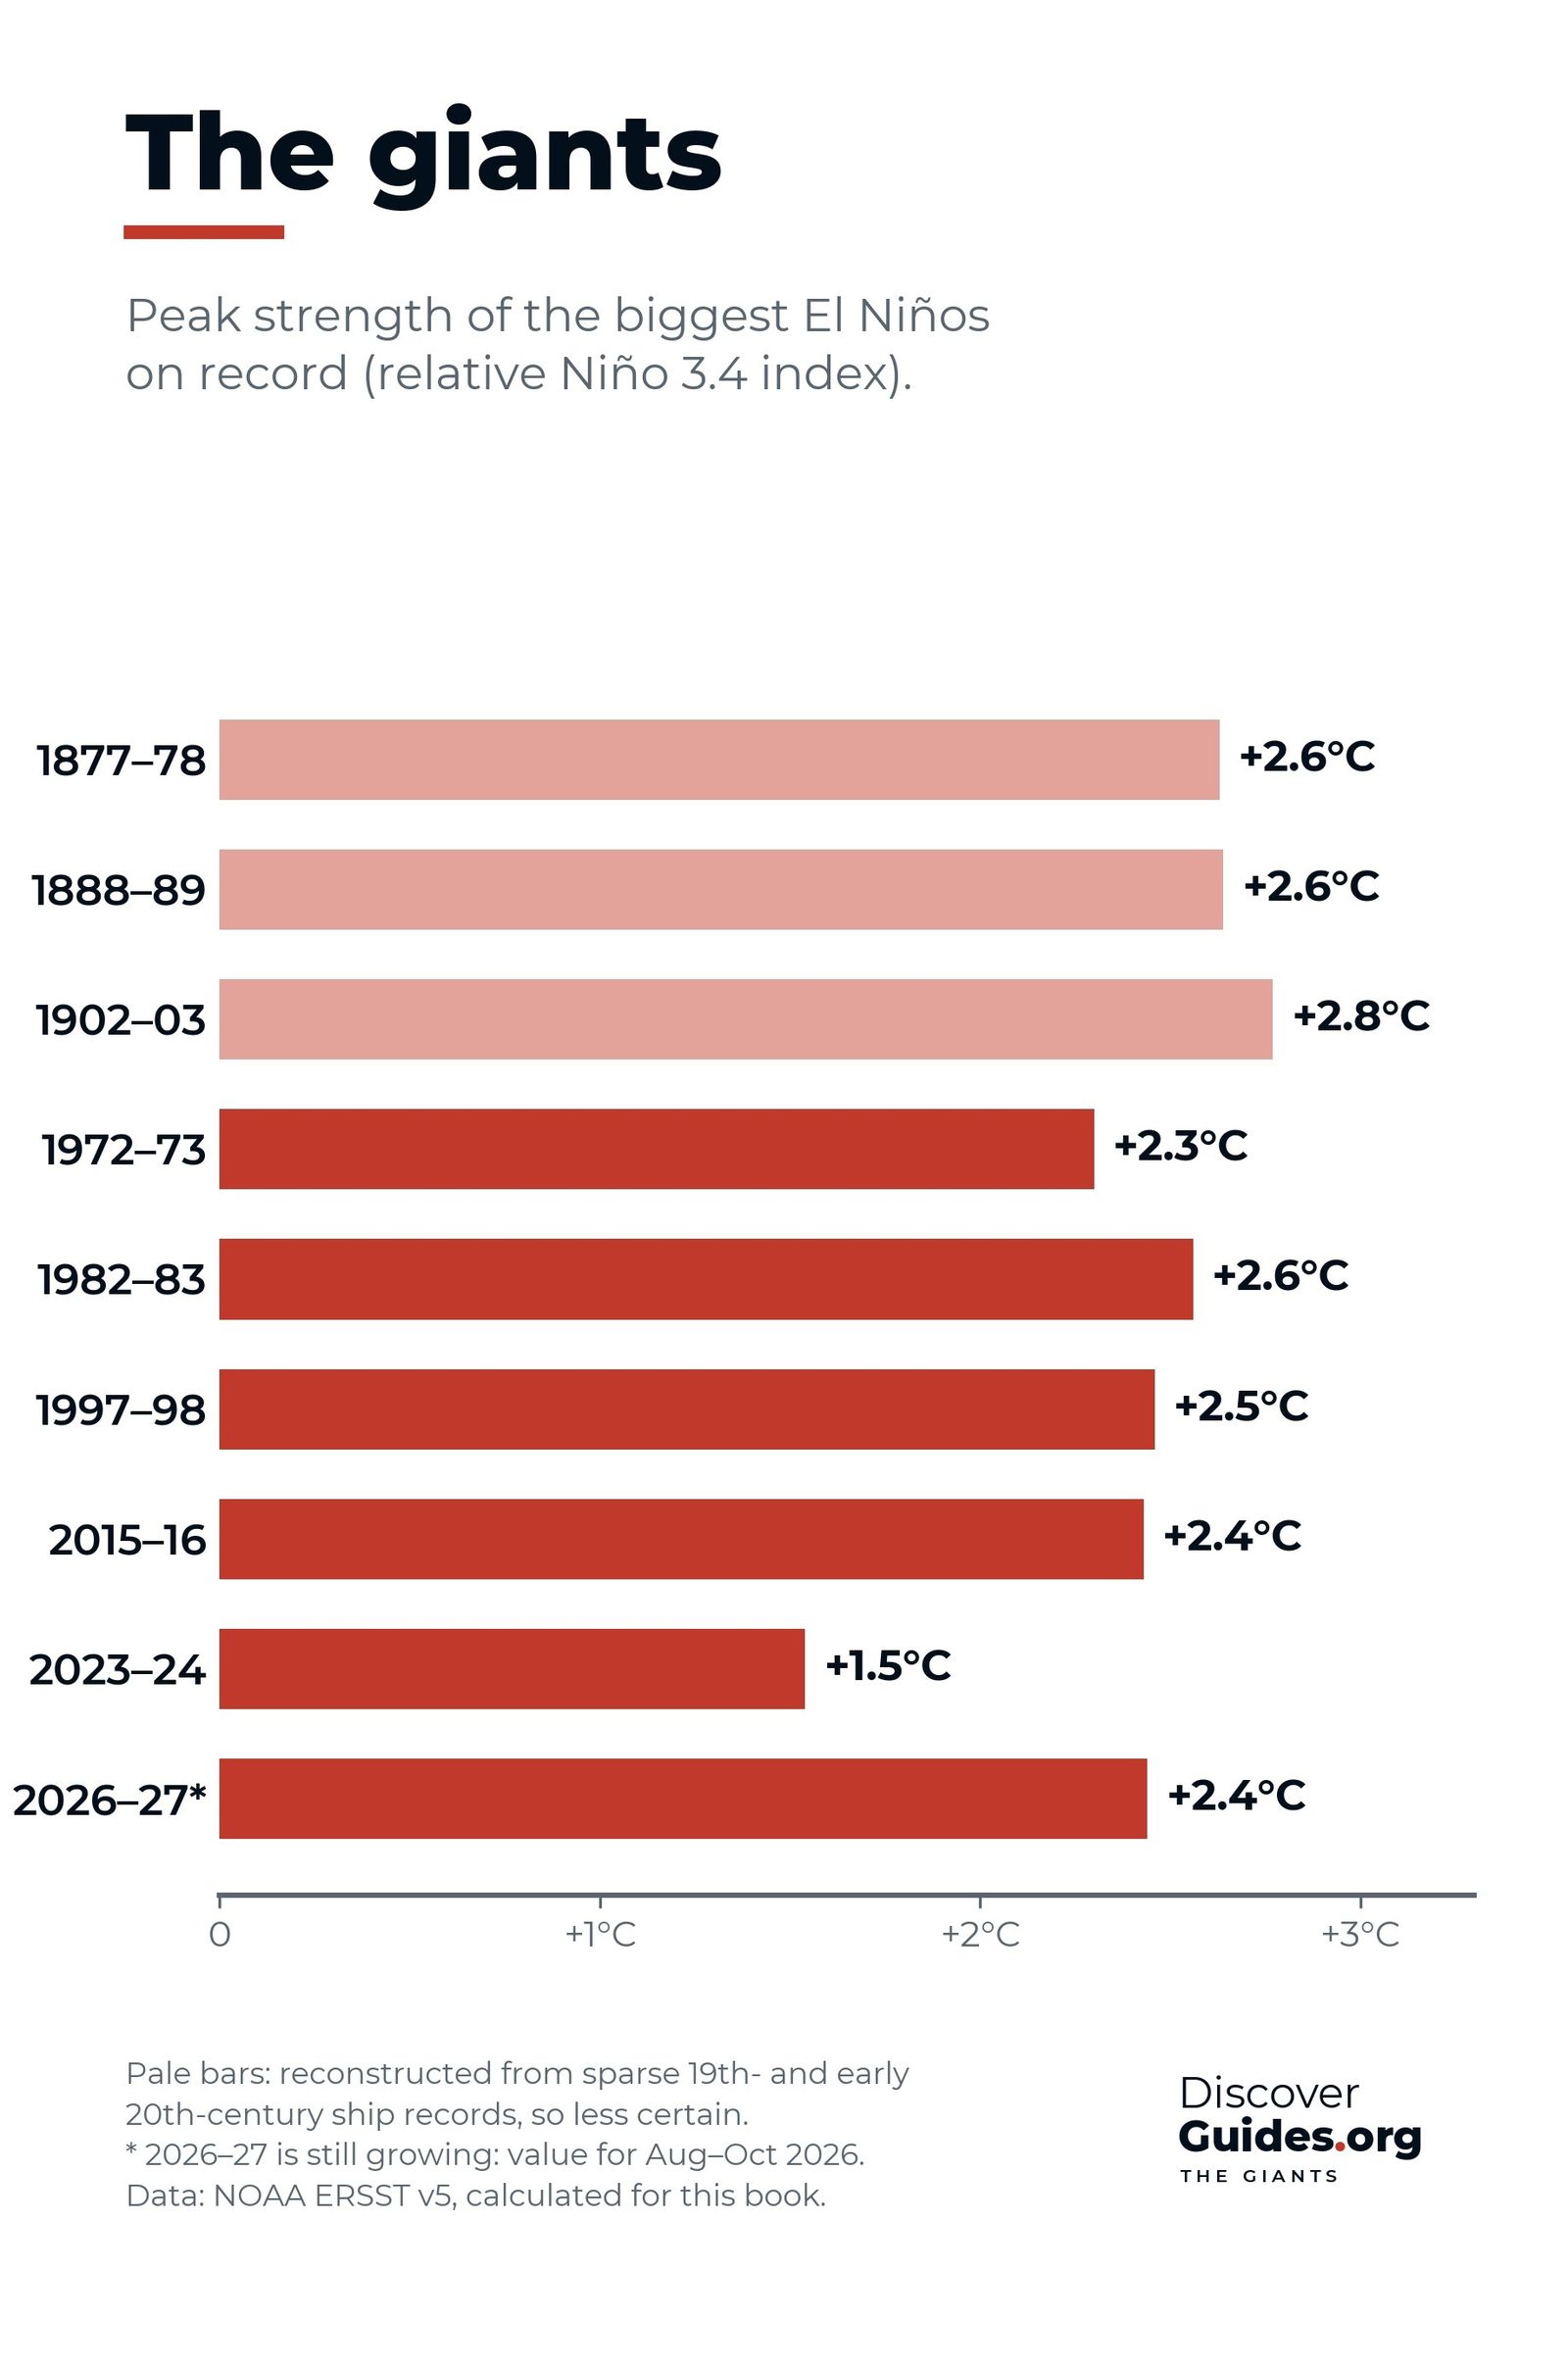
These are the events that stand out in NOAA's records since 1950, ordered by peak on the relative index. Values are three-month peaks from NOAA's current tables and may be revised slightly as datasets are updated.
| Event | Relative index (RONI) | Traditional index (ONI) | Remembered for |
|---|---|---|---|
| 1. 1982-83 | +2.4°C | +2.1°C | Missed by forecasters; Peru floods; Australian drought |
| 2. 1997-98 | +2.3°C | +2.4°C | First forecast giant; Indonesia fires; first global bleaching |
| 2. 2015-16 | +2.3°C | +2.6°C | Indonesia fires; Great Barrier Reef bleaching; 2016 heat record |
| 4. 1972-73 | +2.0°C | +1.8°C | Collapse of Peru's anchoveta fishery |
| 5. 2023-24 | +1.4°C | +2.0°C | 2023 and 2024 heat records; fourth global bleaching |
Notice how the order changes. On the traditional index 2015-16 is the clear record holder. On the relative index it drops into a tie with 1997-98, behind 1982-83, and 2023-24 falls from very strong to moderate. Both events happened when the whole tropical ocean was unusually warm, which the relative index removes.
1. 1982-83: the giant nobody saw coming
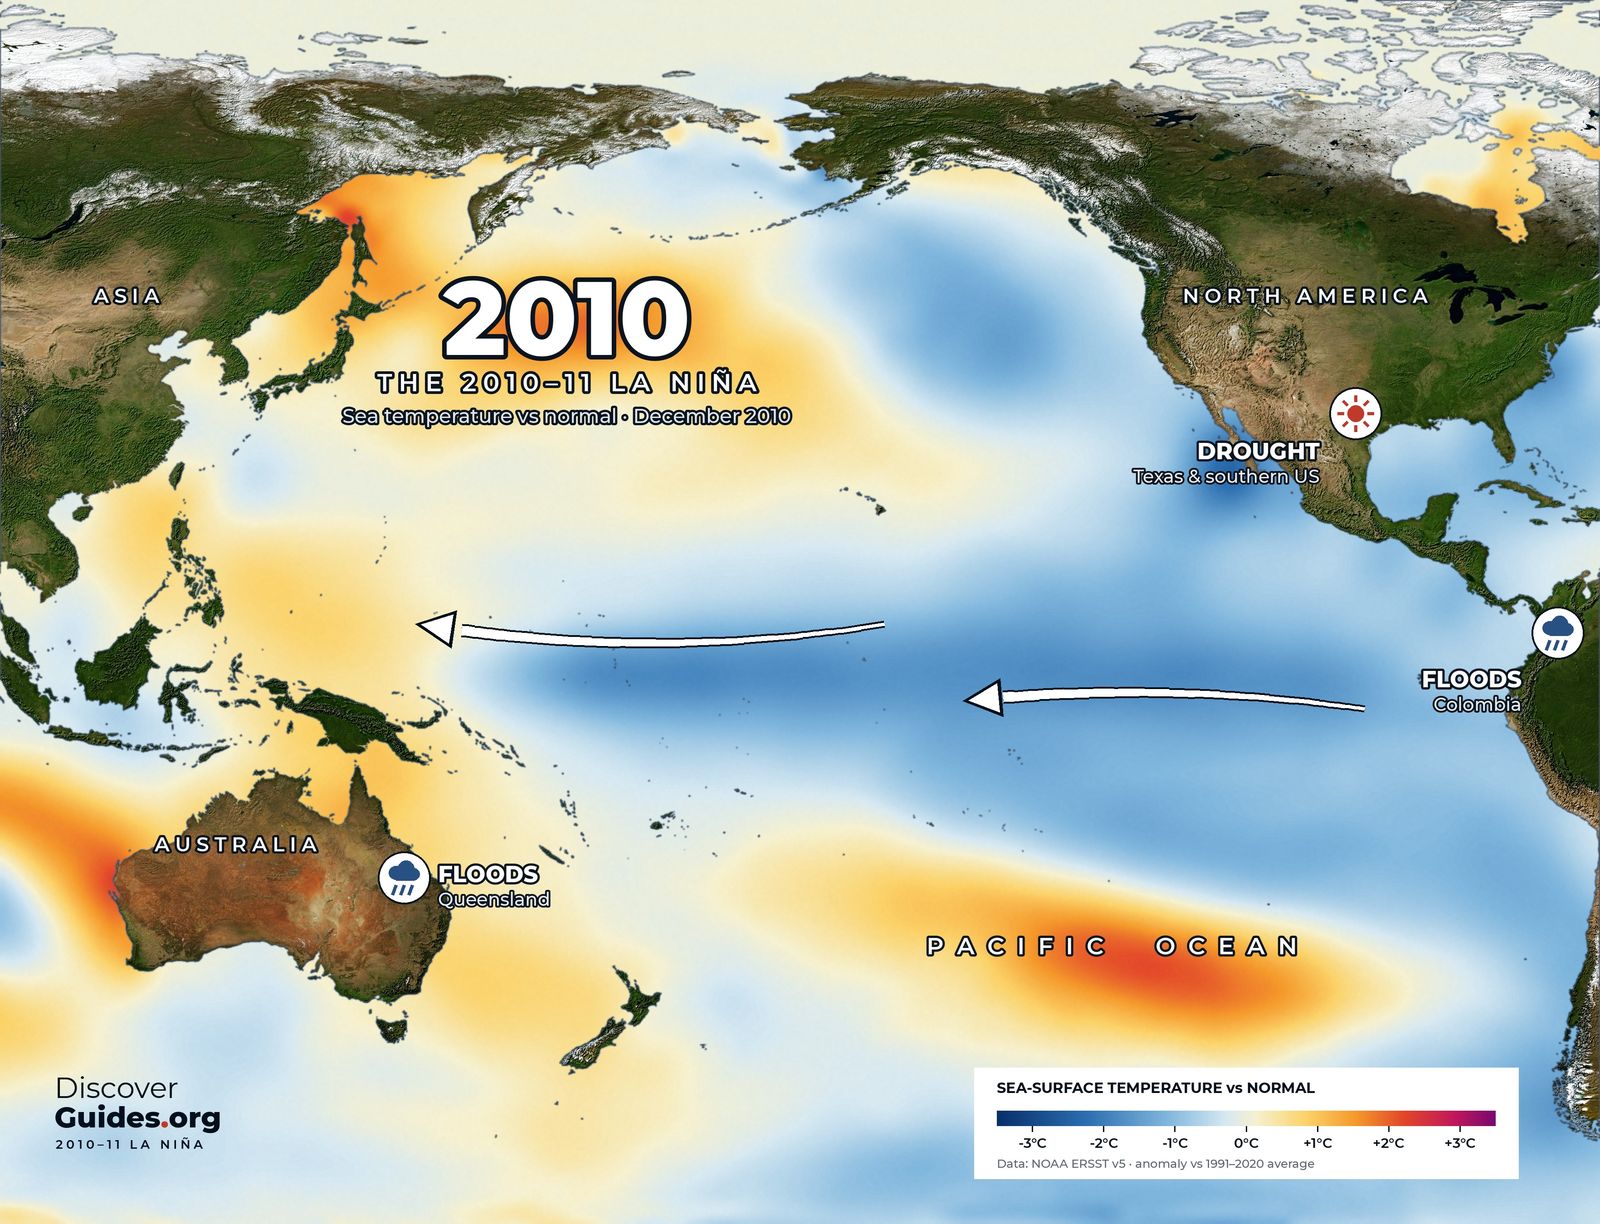
The top-ranked event on NOAA's official index went unrecognised for months, partly because volcanic aerosols from El Chichón fooled the satellites. It brought floods to Peru and Ecuador and one of the century's worst droughts to eastern Australia. Full story: El Niño 1982-83.
2. 1997-98 and 2015-16: the twin peaks
1997-98, the event of the century, was the first giant forecast months ahead. Its warmth was concentrated against South America. 2015-16 peaked a little farther west, set the record on the traditional index and drove the third global coral bleaching event. Its story is told in El Niño 2015-16.
4 and 5: 1972-73 and 2023-24
1972-73 is remembered most in Peru. Anchoveta catches had reached a record 12.4 million tonnes in 1970; El Niño, on top of heavy overfishing, helped crash the fishery in 1972. 2023-24 was modest by the relative measure, yet its timing on a warm planet helped make 2023 and 2024 the hottest years on record.
Before 1950: the reconstructed giants
Earlier events can only be rebuilt from ship logbooks and coastal records, which thin out the further back you go. Reconstructions place three in the top class: 1877-78, 1888-89 and 1902-03. The best known is the Great El Niño of 1877-78, linked to famines that killed tens of millions of people in India, China and Brazil.
What makes a giant
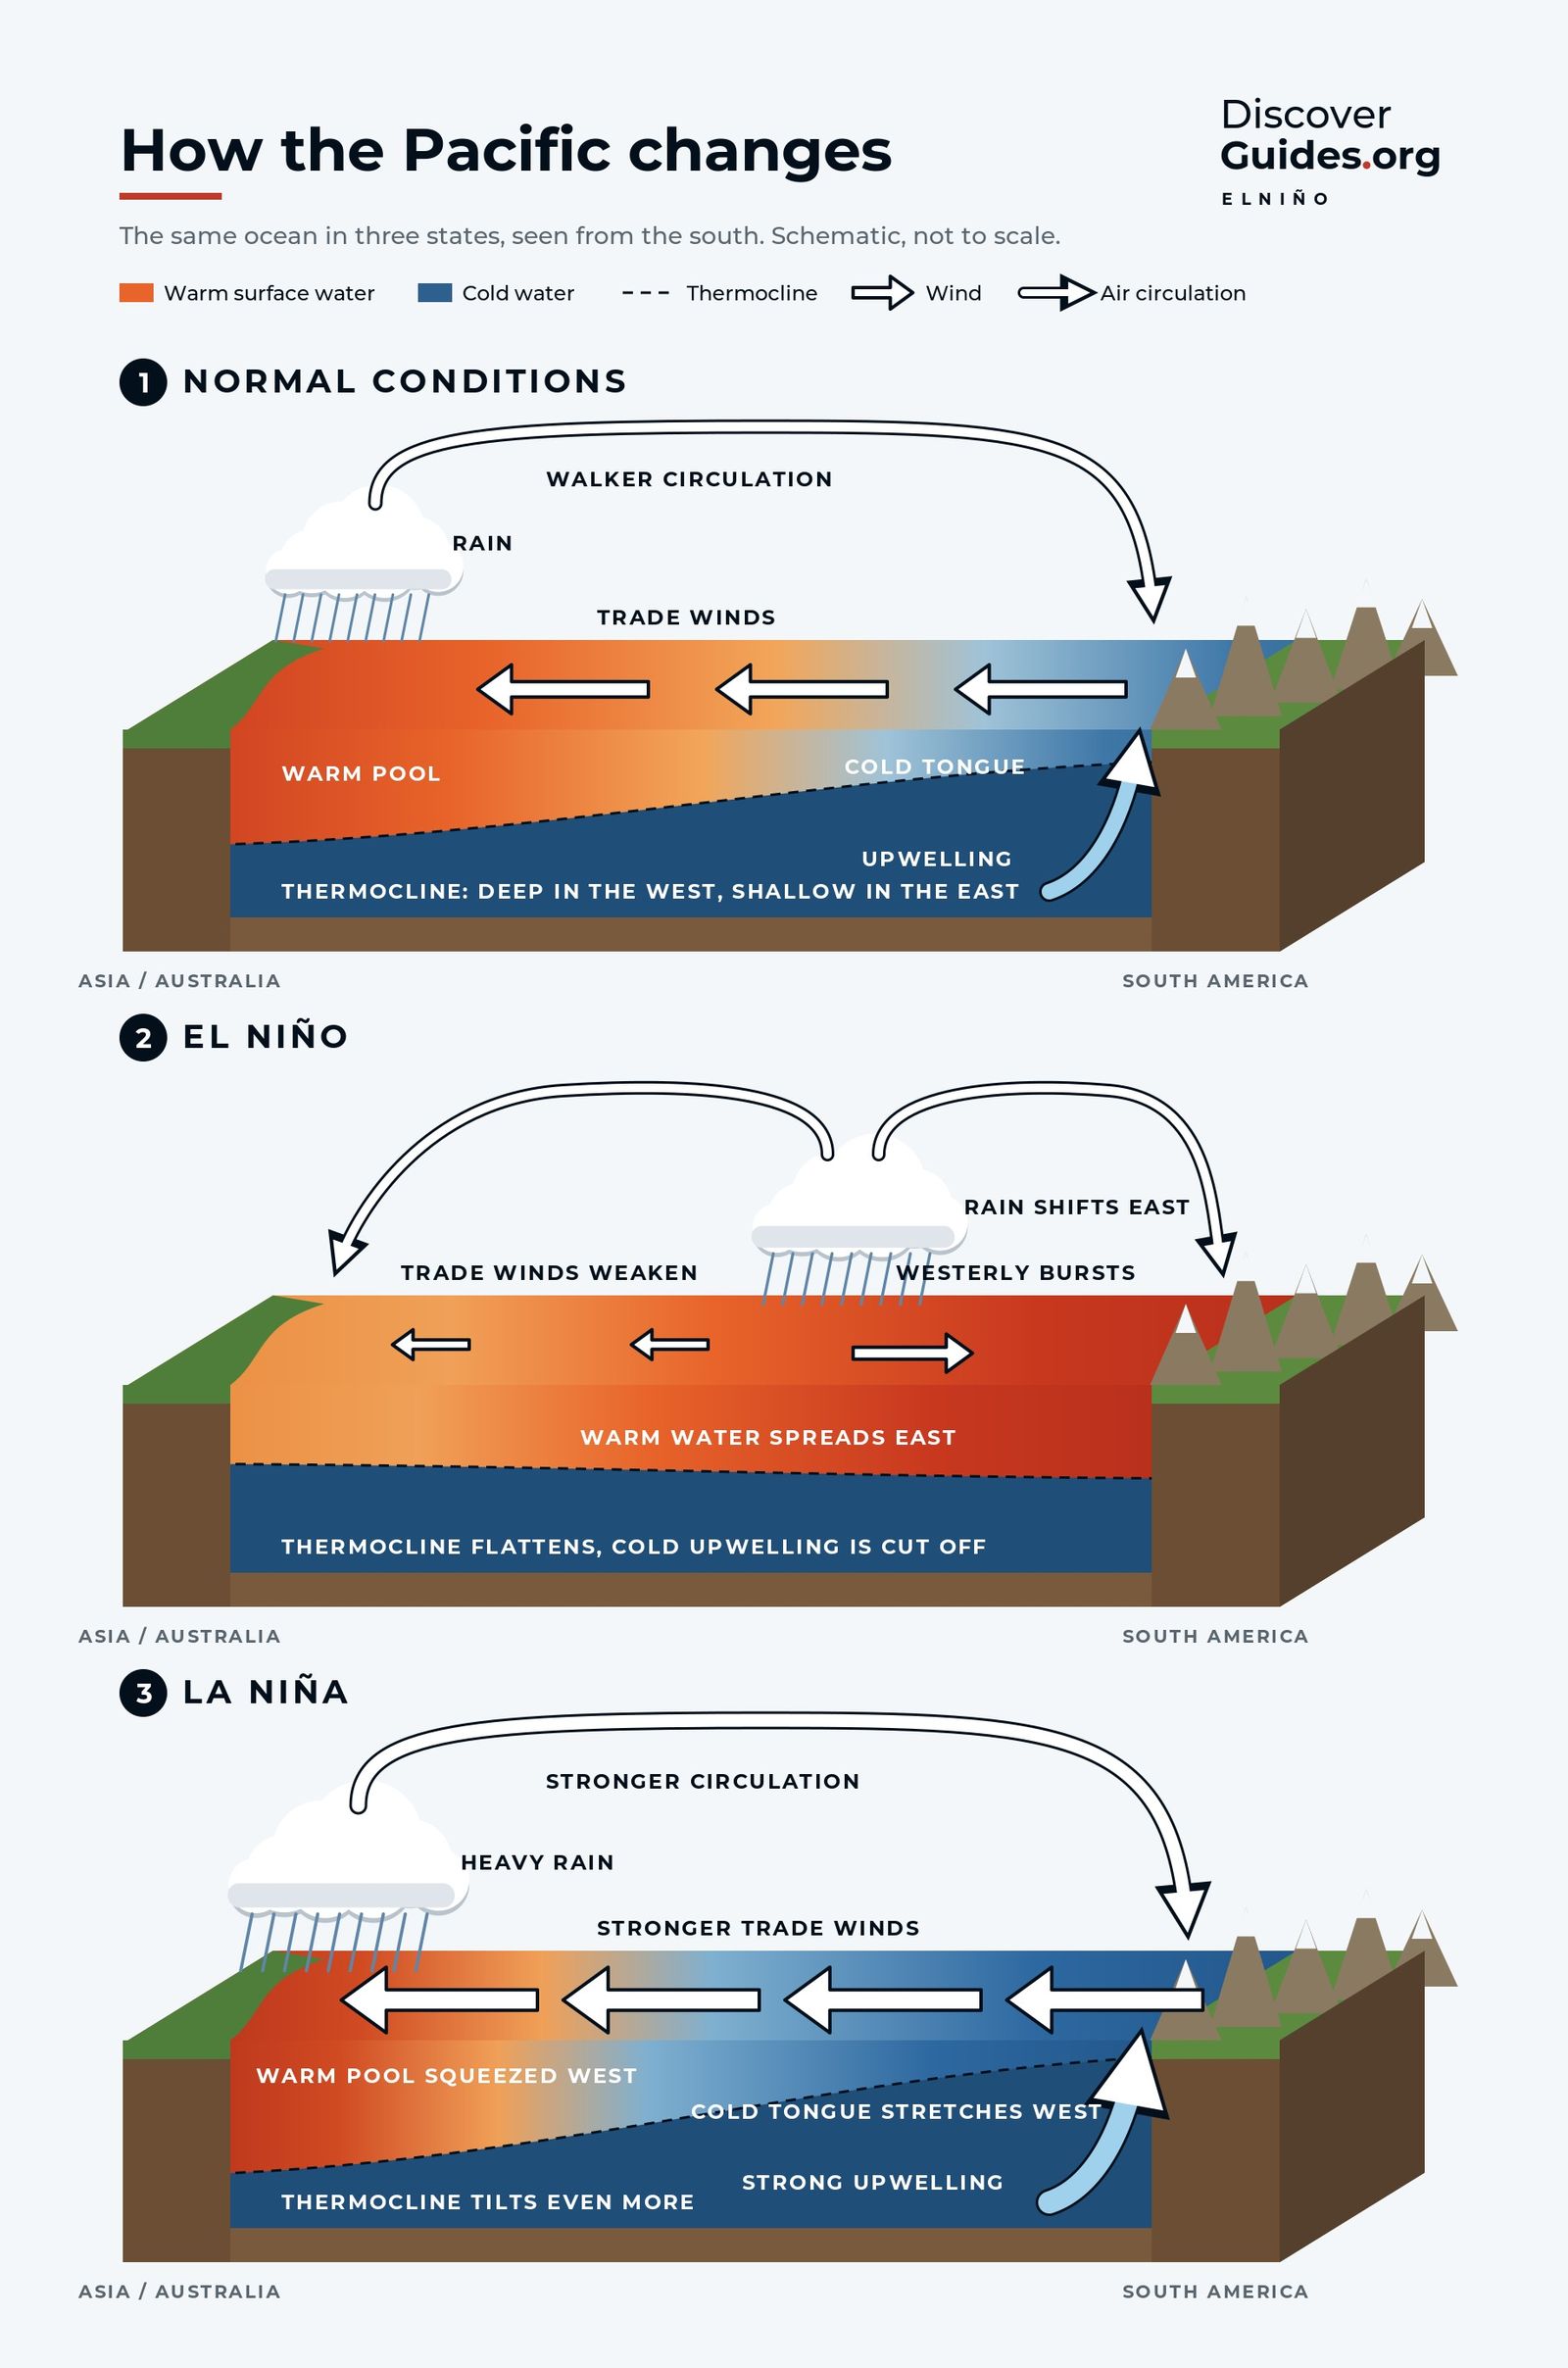
The biggest events share a family resemblance. Each began with the trade winds faltering and bursts of westerly wind in the western Pacific, sending pulses of warm water east below the surface. Each then locked into the feedback at the heart of El Niño: a warmer east weakens the trade winds, and weaker trade winds let the east warm further. And each spread warm water all the way to the coast of South America, deepening the thermocline there so that upwelling could no longer bring up cold water.
Their timing is similar too. The giants grew through the northern summer and autumn, peaked between November and January, and faded by the following summer. Several, including 1997-98 and 2015-16, were followed closely by La Niña.
Why rankings disagree
Different datasets, base periods and averaging windows shift peaks by a tenth of a degree or two. That is why one source lists 1997-98 above 2015-16 and another the reverse. Treat events within about 0.2°C of each other as effectively tied. Strength is also not the same as impact: where the warmth sits, how long it lasts and what the Indian and Atlantic Oceans are doing all shape what happens on land.
Where 2026-27 could land
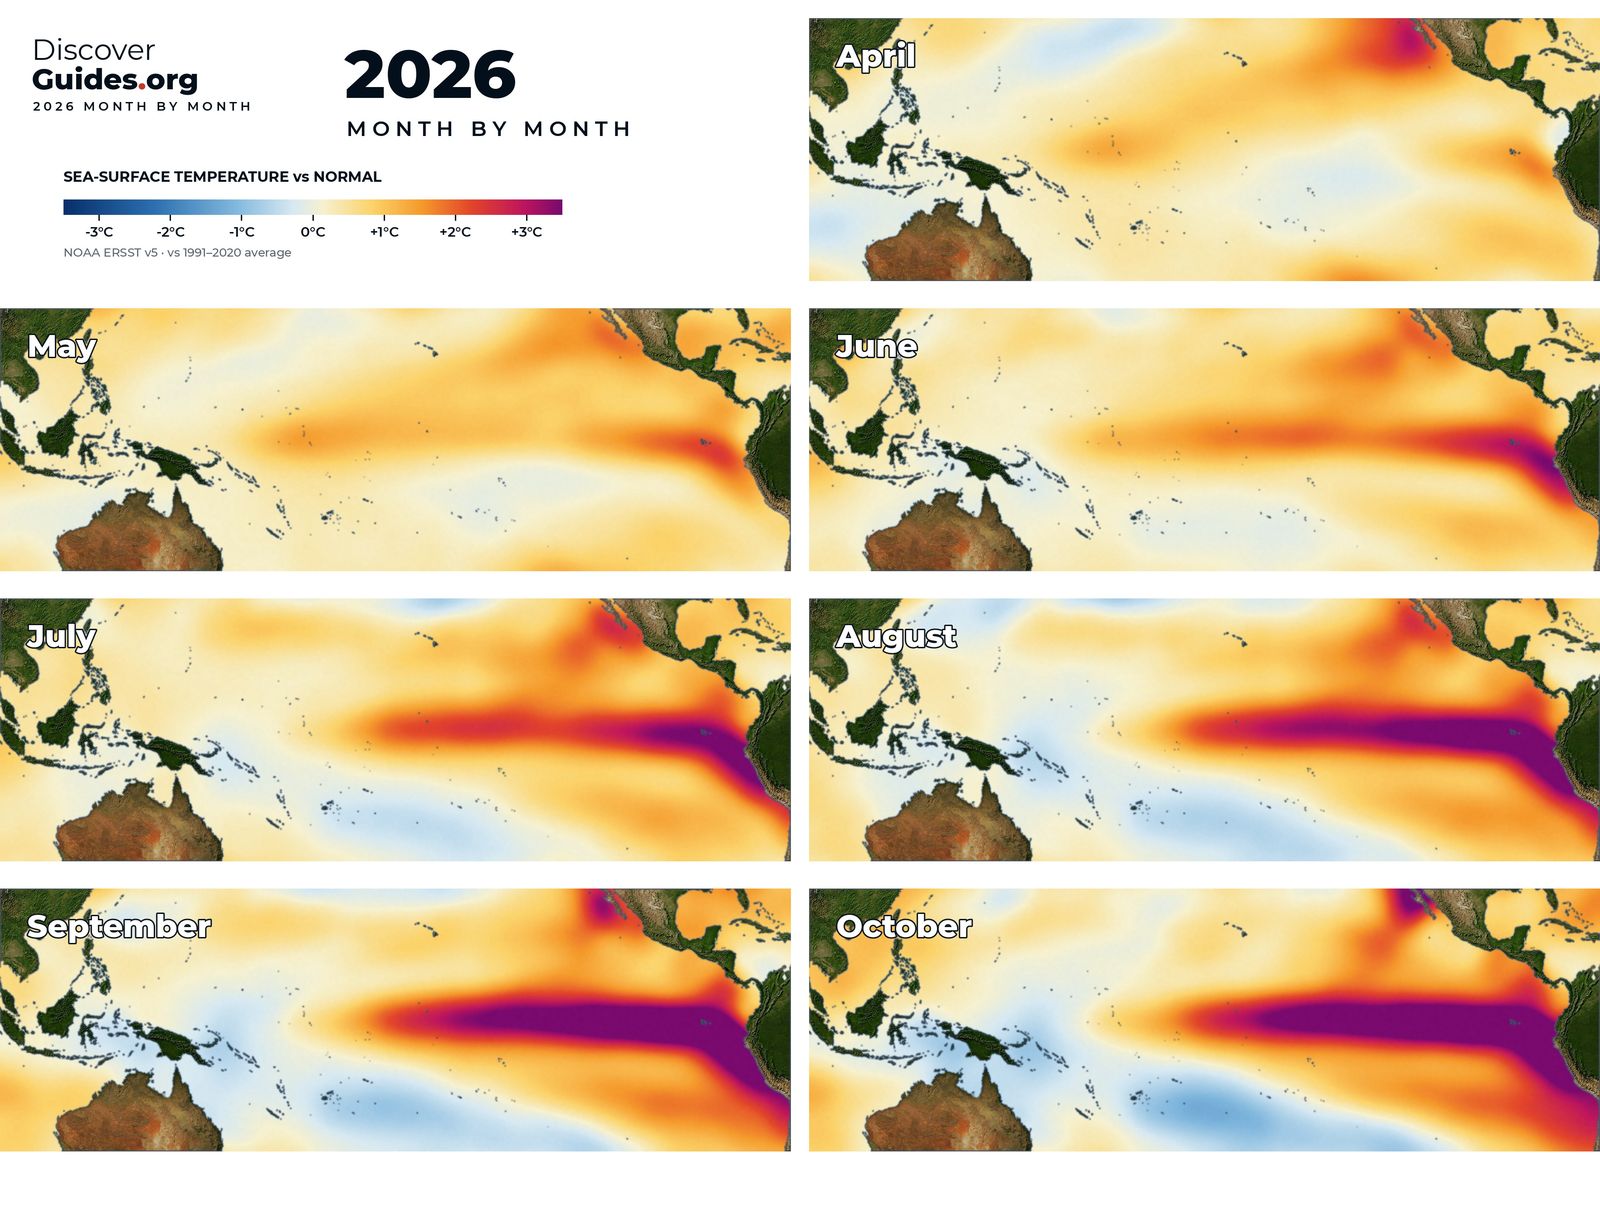
As of NOAA's October 2026 update, the latest monthly Niño-3.4 value was about +2.1°C, with +3.0°C in Niño-3 and +3.9°C in Niño-1+2 off South America. Forecasters put the chance of a three-month relative index of +2.5°C or more, beyond every event since 1950, at 54% for September to November, 83% for October to December and 70% for November to January. Outlooks can change, and the next update is due on 12 November 2026.
If those odds hold, 2026-27 would take the top of this table. The latest is tracked in the 2026-27 super El Niño, and every giant is profiled in the book Discover El Niño.
Questions
What is the strongest El Niño on record?
On NOAA's relative index, now the official measure, 1982-83 has the highest peak since 1950 at about +2.4°C. On the traditional Oceanic Niño Index, 2015-16 holds the record at about +2.6°C.
What counts as a super El Niño?
It is an informal term, usually used for events whose three-month Niño-3.4 index reaches about +2.0°C or more.
Is 2026-27 the strongest El Niño ever?
Not yet confirmed. As of NOAA's October 2026 update, there was an 83% chance that October to December would reach +2.5°C on the relative index, which would beat every event since 1950. Outlooks can change.
Why do El Niño rankings differ between sources?
They use different datasets, base periods and indices. NOAA's relative index removes background warming of the tropics, which lowers recent events such as 2015-16 and 2023-24 compared with the traditional index.